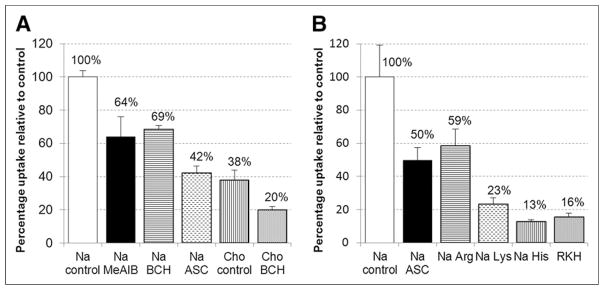
FIGURE 3.

In vitro uptake of 18F-AFETP by DBT glioma cells in presence of neutral (A) and cationic (B) competitive inhibitors of the amino acid transport. Uptake data are normalized based on amount of activity added to each well and total amount of protein in each well. Data are expressed as percentage uptake relative to sodium control condition, and values for each condition are noted in appropriate bars. To provide consistent osmolarity, compared with inhibitory conditions, Na control and Cho controls contain 10 mM sucrose. ASC = 3.3 mM each of L-Ala, L-Ser, L-Cys; BCH = 10 mM 2-aminobicyclo(2,2,1)-heptane-2-carboxylic acid (system L inhibitor); Cho = assay buffer containing choline ions; MeAIB = 10 mM N-methyl, α-aminoisobutryic acid (system A inhibitor); Na = assay buffer containing sodium ions; RKH = 3.3 mM each of L-arginine, L-lysine, and L-histidine.
