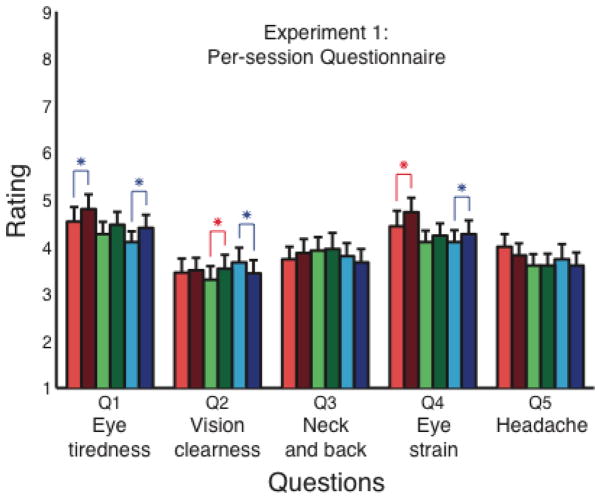
Figure 2.
Per-session Questionnaire data from Experiment 1 averaged across subjects. Red, green, and blue bars represent the data with fast, medium, and slow frequencies, respectively. Light and dark bars represent the data from the natural-viewing and conflict sessions, respectively. Error bars represent standard errors. The red asterisks indicate pair-wise differences that were statistically significant (Wilcoxon signed rank test, p < 0.05) and blue asterisks difference that were marginally significant (p < 0.10). In question 1, 2, and 4, conflict sessions were more fatiguing than natural-viewing sessions.

