
Figure 2.
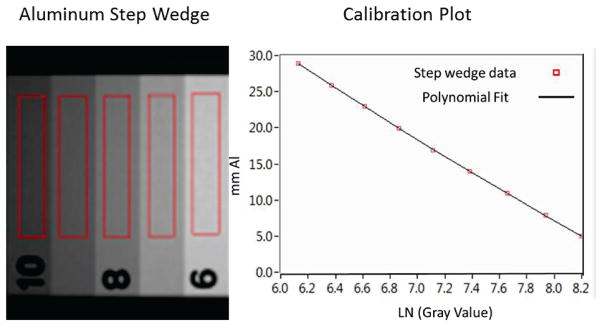
Sample image of the step wedge and the ROI’s used to calculate the average gray value. Example of a plot of aluminum thickness versus gray value and logarithmic fit; such curves were derived for every exposure setting.
Official websites use .gov
A
.gov website belongs to an official
government organization in the United States.
Secure .gov websites use HTTPS
A lock (
) or https:// means you've safely
connected to the .gov website. Share sensitive
information only on official, secure websites.
Sample image of the step wedge and the ROI’s used to calculate the average gray value. Example of a plot of aluminum thickness versus gray value and logarithmic fit; such curves were derived for every exposure setting.