Fig. 3.
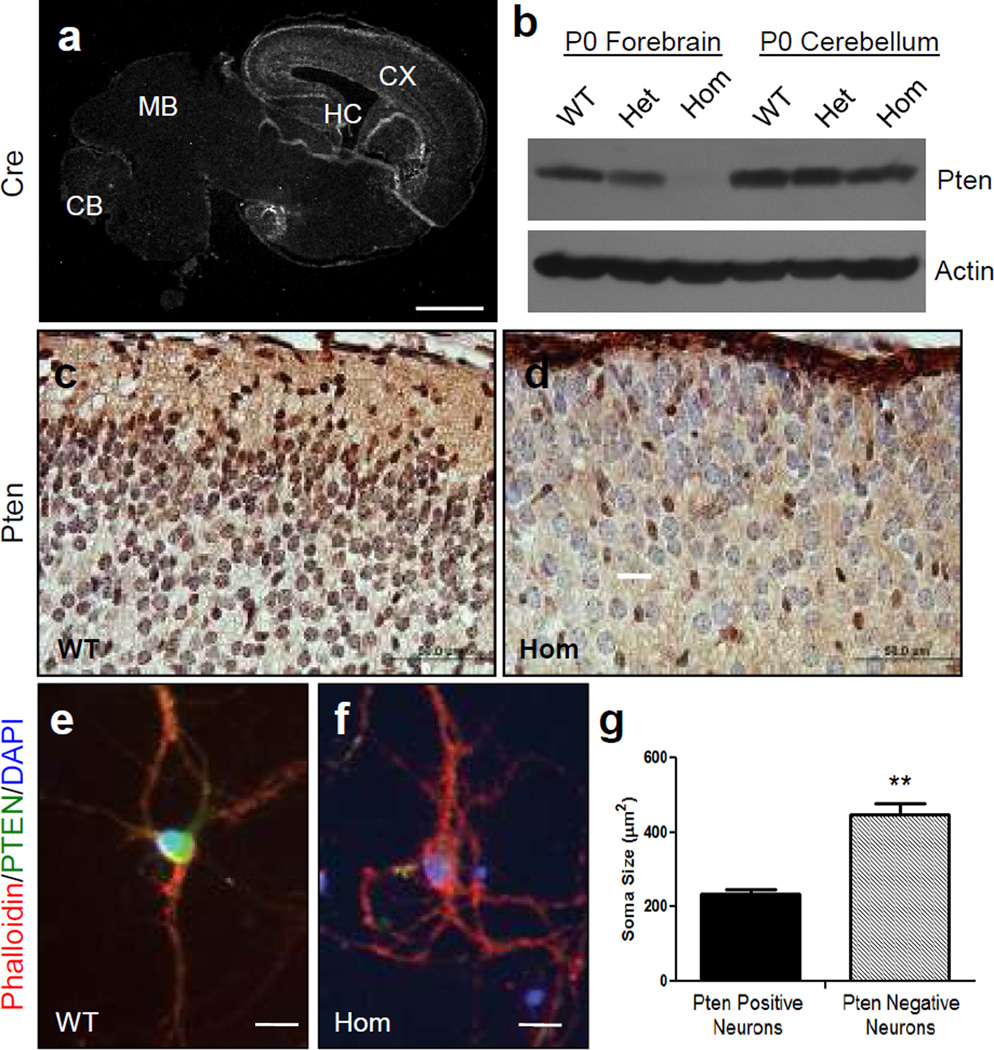
Pten deletion in excitatory cortical neurons results in increased soma size. a Brain sections obtained from P0 wild type (WT) mice in the NEX- Pten colony were processed for immunofluorescence using Cre antibodies. A low magnification confocal image shows widespread expression in the cerebral cortex (CX) and hippocampus (HC), but not in the midbrain (MB) or cerebellum (CB). b Western blot analysis of the forebrain and cerebellum of newborn wild type (WT), heterozygous (Het), and homozygous (Hom) NEX-Pten littermates. The blot, which is representative of data obtained from 3 sets of littermates, was probed with Pten antibodies and then reprobed with actin antibodies to ensure equal protein loading. Pten expression is progressively reduced in the forebrain of heterozygous and homozygous mutants. c, d Pten immunohistochemistry staining (brown) of brain sections obtained from WT and Hom NEX-Pten littermates. Sections were counterstained with cresyl violet. Brightfield images of the upper cortical layers show that the majority of cells are Pten-positive in wild type and Pten-negative in homozygous mutants. Pten-negative cells appeared enlarged, and some protrude in the marginal zone near the pial surface. e, f Confocal images of representative dissociated cortical neurons cultured for 15 DIV and triple-labeled with rhodamine-phalloidin (red), Pten antibodies (green) and DAPI (blue). g Soma size comparison between Pten-positive (n= 35) and Pten-negative cultured neurons (n=22). The difference is statistically significant (p<0.05). Scale bars = 1 mm (a), 50 µm (c and d), 20 µm(e and f).

