
Figure 1. Characterization of Mutations.
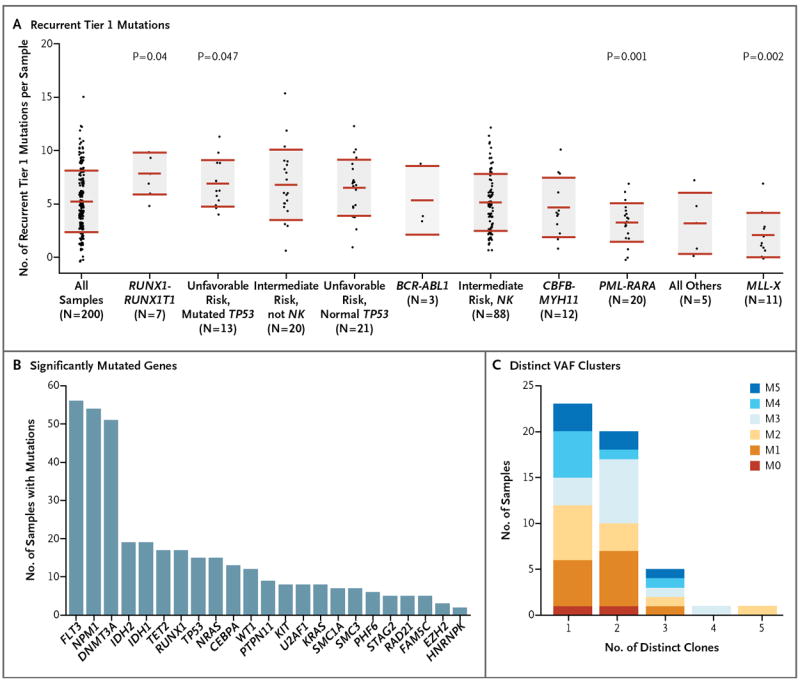
Panel A shows the numbers of verified, recurrent tier 1 mutations in each of 200 samples obtained from patients with AML, organized according to important cytogenetic and mutational findings. For each set of data, the middle horizontal line indicates the mean, and the shaded area indicates ±1 SD. P values are shown for the groups that had significant differences from the mean number of recurrent tier 1 mutations in all samples. NK denotes normal karyotype. Panel B shows significantly mutated genes, as identified by the MuSiC analysis suite,20 and the number of samples with each mutation. Panel C shows the number of discrete clusters of mutations with distinct variant allele frequencies (VAFs) for each of 50 samples that underwent whole-genome sequencing. Each discrete VAF cluster represents a founding clone or a subclone derived from it.17,18 Samples with one clone have only a founding clone, those with two clones have a founding clone and one subclone, those with three clones have a founding clone and two subclones, and so forth. Exome sequencing defined too few mutations to accurately define subclones. Each sample contained evidence of a single founding clone, and most had one or more subclones derived from the founding clone. The French–American–British (FAB) subtypes of the samples are designated. (See Table 1 for FAB subtypes of AML.)