
Figure 6.
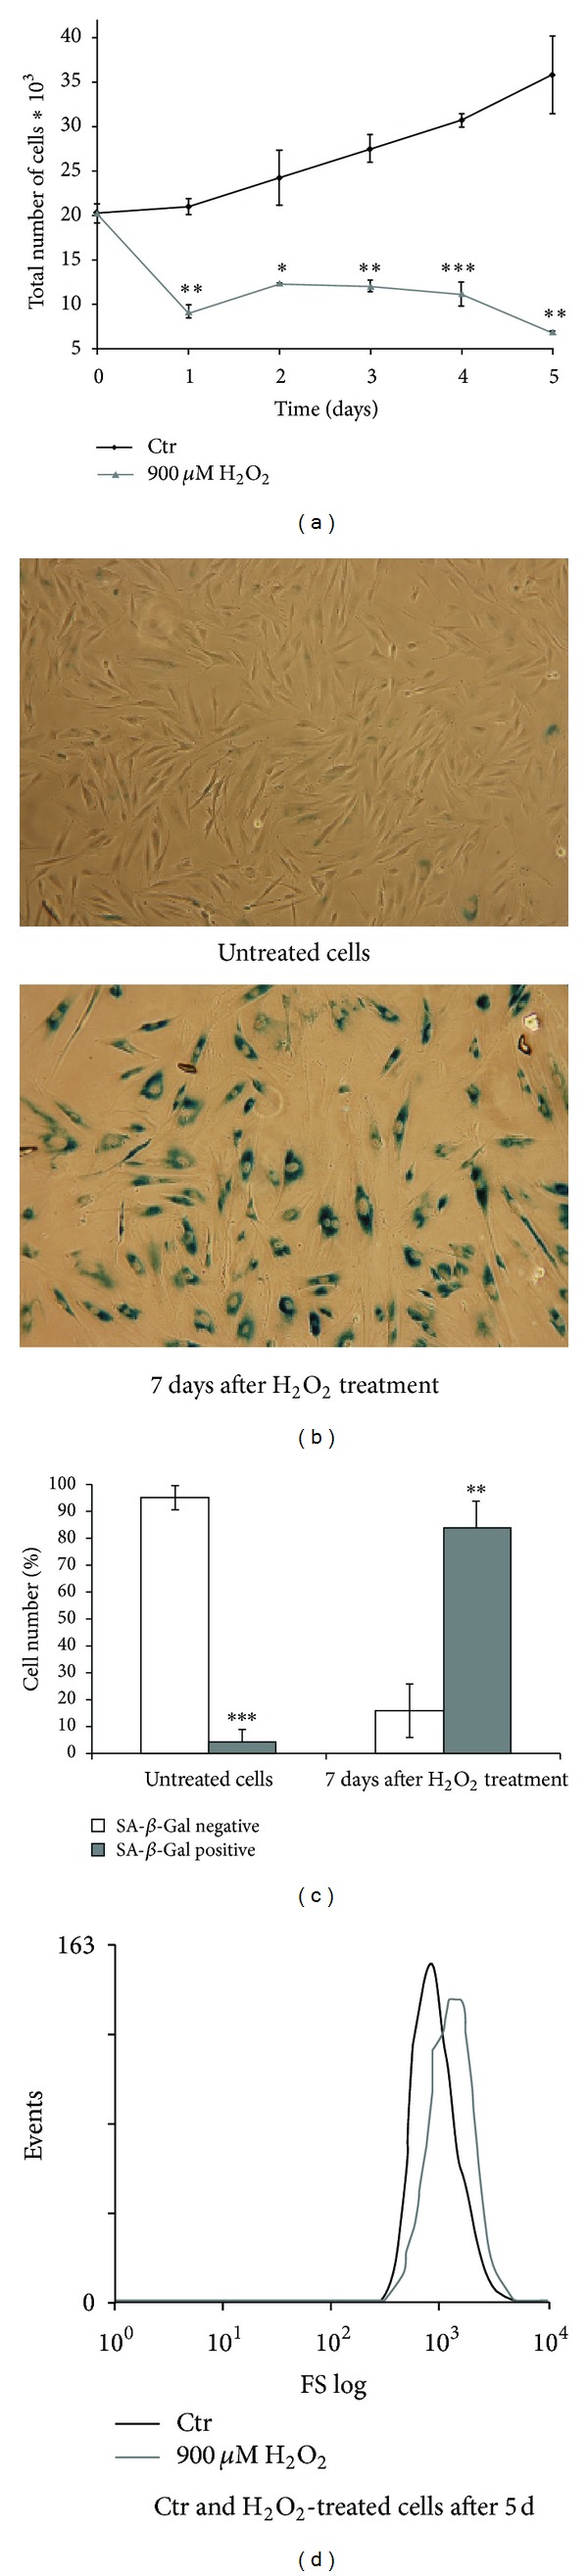
The senescent phenotype in hMESCs treated with 900 μM H2O2. (a) H2O2-induced inhibition of cell proliferation (M ± SEM, n = 3). (b) SA-β-Gal staining. (c) Quantitative assay of SA-β-Gal-positive cells. (d) Cell hypertrophy detected by light-scattering cytometry. Significant difference was based on the Student's t-test (*P < 0.05, **P < 0.01, and ***P < 0.001). Control (Ctr): untreated cells.