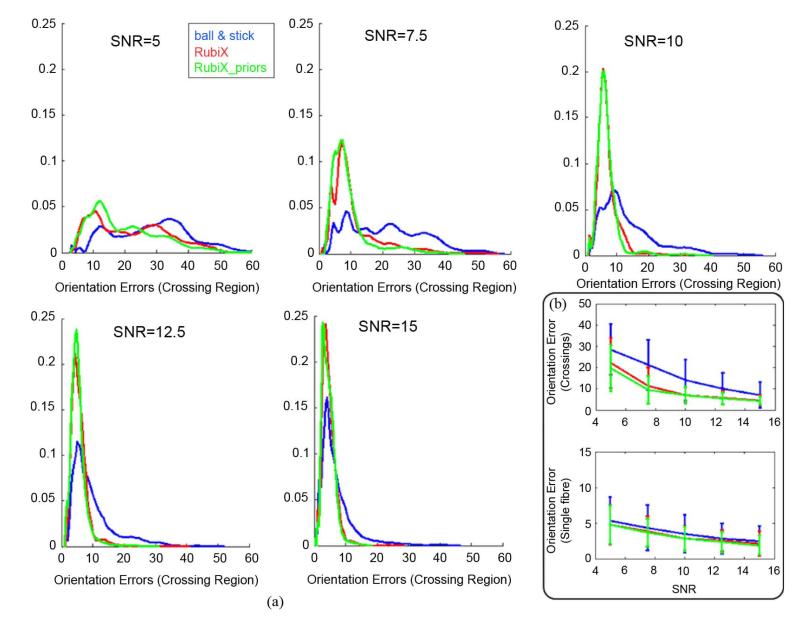
Fig. 3.
(a) Normalized histograms of orientation errors (in degrees) at the crossing region of the phantom. The fiber orientations estimated using different methods (ARD for volume fractions is off) are compared to the ground truth orientations for different SNR levels. SNR is of the HR grid. (b) Errorbars showing the mean (±standard deviation) of orientation errors at the crossing and the single-fiber region of the phantom, as a function of the HR SNR. b = 1000 s/mm2 was used for both grids of the RubiX dataset.

