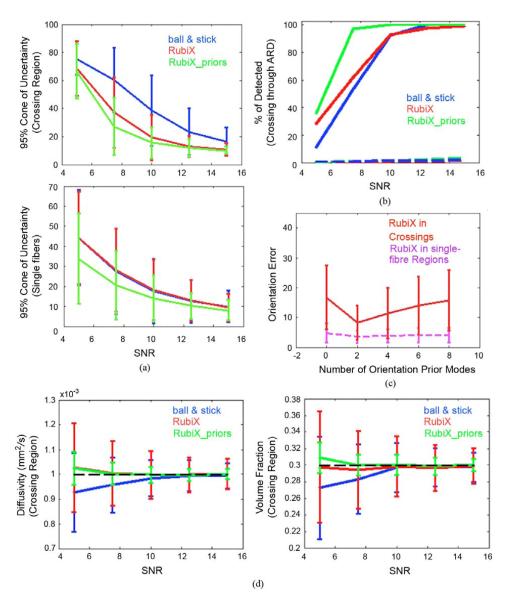
Fig. 4.
(a) Cones of uncertainty (95%) of the estimated orientations at the crossing and single-fiber region of the phantom, using different methods, as a function of the HR SNR. Vertical axis is in degrees. (b) Effectiveness of the ARD prior on the volume fractions to detect crossings. Solid lines correspond to the % of correctly resolved crossings. Dashed lines correspond to false positives, crossings identified in the single-fiber region. (c) The effect of the number of modes L of the RubiX conditional prior on the orientations. Errorbars indicate the mean (±standard deviation) orientation error (in degrees). SNR of the HR data was 7.5. (d) Diffusivity and volume fraction estimates at the crossing region, as a function of the HR SNR. Errorbars represent the mean (±standard deviation) of the estimates. For the volume fraction values, the mean of f1 and f2 in the crossing region is reported. The ground-truth values are depicted by the dashed black lines.

