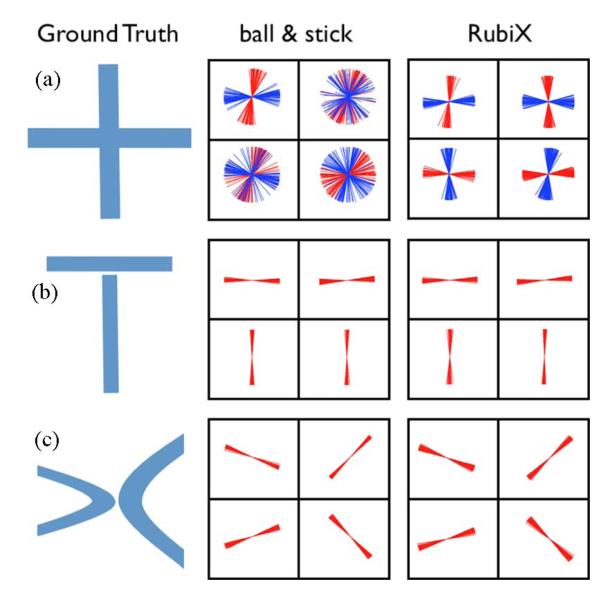
Fig. 5.
Localization of different fiber configurations using RubiX. (a) Orthogonal crossing. (b) “Sandwich” crossing. (c) Fiber kissing. In each voxel, samples from the posterior distribution of the orientations have been plotted to illustrate the uncertainty associated with each estimated orientation. Notice that (a) and (b) will give the same LR data. The SNR of the HR data was 7.5 and b = 1000 s/mm2 for both resolutions. An ARD prior has been applied to f2, for automatically detecting fiber crossings.

