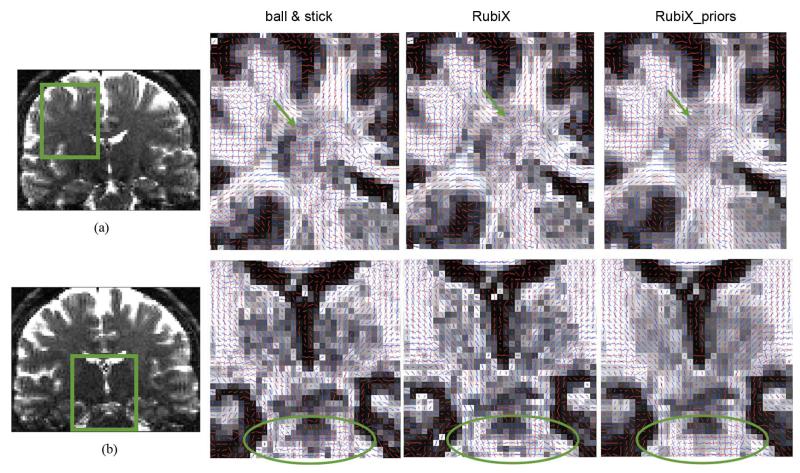
Fig. 6.
Coronal views of mean estimated orientations of two fiber compartments for different models (from left to right): The ball & stick model, the RubiX model with orientation conditional priors and the RubiX model with orientation, volume fraction (fs) and diffusivity (d) conditional priors. (a) Area close to the centrum semiovale (green arrow). (b) Region around the orthogonal crossing between the corticospinal tract and the transverse pontine fibers (shown encircled). The orientation vectors are superimposed on the fs maps, estimated by each method. A second orientation vector is shown in blue only for voxels where f2 > 5%.

