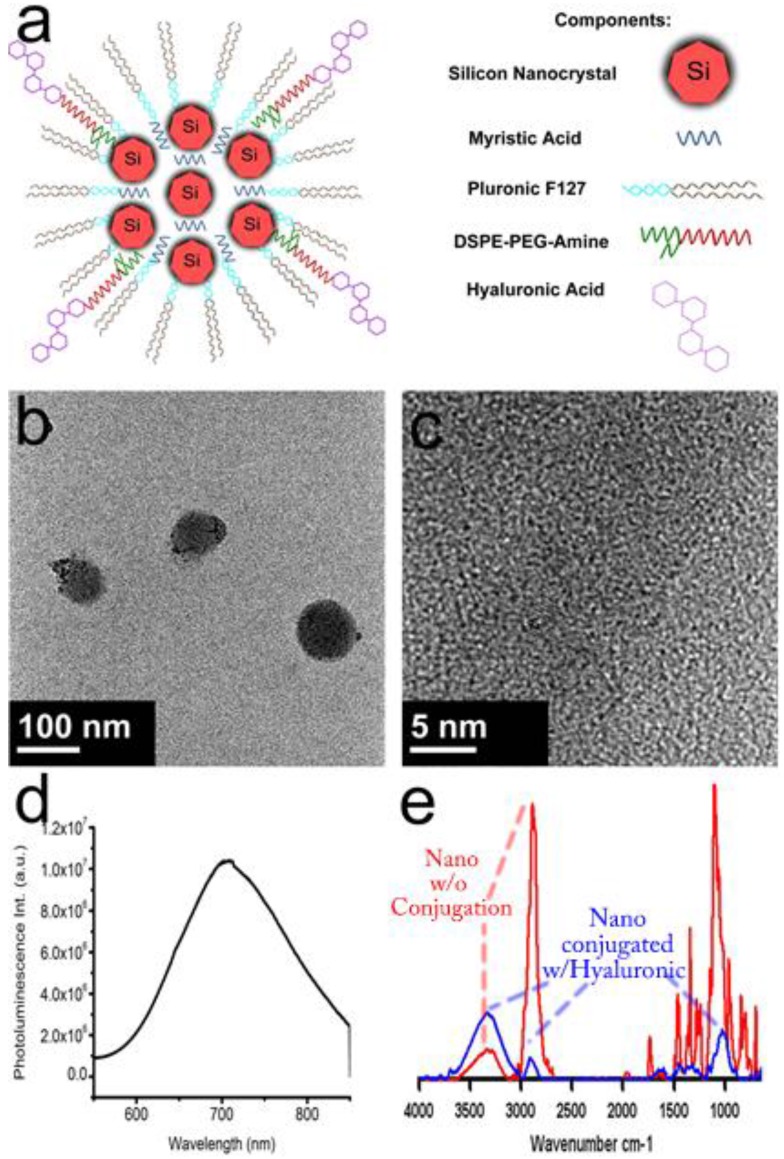
Fig 3.
Composite diagram containing formulation schematic, TEM, photoluminescent emission, and FTIR spectra. (a) schematic of theranostic nanoconstruct (further details of self-assembly of lipid micelles are shown in Supplementary Material: Figure S1); (b) low-resolution TEM of nanoconstructs; (c) high resolution TEM showing crystalline Si nanocrystals within the constructs (larger image is shown in Supplementary Material: Figure S2); (d) photoluminescence emission spectrum of nanoconstructs; and (e) FTIR spectra of nanoconstructs before (red) and after (blue) conjugation with hyaluronic acid.

