

Abstract
Theoretical considerations together with simulations of single-particle electron cryomicroscopy images of biological assemblies in ice demonstrate that atomic structures should be obtainable from images of a few thousand asymmetric units, provided the molecular weight of the whole assembly being studied is greater than the minimum needed for accurate position and orientation determination. However, with present methods of specimen preparation and current microscope and detector technologies, many more particles are needed, and the alignment of smaller assemblies is difficult or impossible. Only larger structures, with enough signal to allow good orientation determination and with enough images to allow averaging of many hundreds of thousands or even millions of asymmetric units, have successfully produced high-resolution maps. In this review, we compare the contrast of experimental electron cryomicroscopy images of two smaller molecular assemblies, namely apoferritin and beta-galactosidase, with that expected from perfect simulated images calculated from their known X-ray structures. We show that the contrast and signal-to-noise ratio of experimental images still require significant improvement before it will be possible to realize the full potential of single-particle electron cryomicroscopy. In particular, although reasonably good orientations can be obtained for beta-galactosidase, we have been unable to obtain reliable orientation determination from experimental images of apoferritin. Simulations suggest that at least 2-fold improvement of the contrast in experimental images at ∼10 Å resolution is needed and should be possible.
Keywords: perfect images, cryoEM, single particles, apoferritin, beta-galactosidase, tilt pairs
Introduction
It has been known for many years that the amount of contrast observed in low-dose images of biological structures is less than expected theoretically. By comparing electron diffraction amplitudes from two-dimensional (2D) crystals of organic or biological specimens with the amplitudes from Fourier transforms of low-dose images of the same crystals on the same thin carbon support film, it was shown 30 years ago [1] that the contrast in room temperature images was less than expected. The electron dose used for imaging 2D crystals is normally somewhat higher than that used for diffraction, but the effect of radiation damage is not enough to explain this loss of contrast. In a later evaluation, an even more rapid fall off in image amplitude with resolution was observed in images of tobacco mosaic virus (TMV) in thin films of amorphous ice on holey carbon films [2], when compared with that obtained from X-ray diffraction patterns of TMV. In particular, the amplitude of the 11Å resolution layer line was <5% of what might be expected in a perfect image recorded from an undamaged specimen with a perfect detector. Part of this reduction in amplitude is due to the poor modulation transfer function (MTF) of the actual detectors used for image recording [3,4]. Another part is due to the fact that radiation damage causes a more rapid fading of high resolution Fourier components when compared with that at lower resolution [5].
However, a major contribution to the reduced contrast at high resolution also comes from image blurring because of beam-induced specimen or image movement. Recent publications [6–8] have shown that during a typical low-dose exposure, single particles suspended in thin films of amorphous ice not only undergo translational motions, but regions of ice can also reorient by as much as 4° in a doming movement. Such doming was observed previously [9] in a study that compared the beam-induced movement of ice at liquid helium temperature with that at liquid nitrogen temperature. The movement and consequential blurring were found to be increased at liquid helium temperature compared with liquid nitrogen temperature [9]. The combined effects of all sources of specimen or image movement on the image amplitudes can be approximately described by a B-factor weighting, given by exp(−B/4d2), in which d is the spatial resolution. In practice, the resolution dependence of fading often deviates from this simple analytical form. The image blurring directly affects the resolution of any structure that is calculated from the images. It also has an indirect effect by reducing the accuracy with which the single-particle orientations can be determined [6], resulting in increased computational blurring that translates into an increase in the apparent B-factor of the final structure [10].
If perfect images limited only by radiation damage could be obtained, it should be possible to obtain 3D structures by single-particle electron cryomicroscopy from images of a few thousand asymmetric units [11]. To this end, it is clear that better specimen preparation methods, better detectors with improved detective quantum efficiency (DQE) and better data analysis techniques will all help. DQE is defined as the ratio of the square of the detector signal-to-noise of the output when compared with the input [3]. Note that a poor detector MTF does not by itself reduce the signal-to-noise ratio in the image, and loss of contrast due to a low MTF can easily be restored. To reduce beam-induced specimen movement, an approach similar to that used to obtain nearly perfect images [4] of 2D crystals of paraffin is one of many that may be useful. In that case, very thick carbon reduced the amount of beam-induced movement. In the meantime, it is useful to estimate how good our best current images are and how much better they need to be before we reach the limits imposed by the physics of radiation damage.
With this in mind, we present a comparison of experimental images of apoferritin with simulated images in which the signal-to-noise ratio at higher resolution is reduced by varying amounts by applying different B-factors that affect the signal, but not the noise and thereby simulate different amounts of image blurring. We also compare the experimental amplitudes in a 3D map obtained from images of beta-galactosidase with those from a solvent-corrected atomic model. We conclude that the experimental images still can be, and need to be, significantly improved to achieve higher resolution and to extend single-particle electron cryomicroscopy (cryoEM) to smaller molecular assemblies.
Comparison of theoretical with experimental images of apoferritin
Figure 1 shows examples of experimental (a) and simulated (b) images of apoferritin. The 24 subunits in each apoferritin molecule assemble into a particle with octahedral, 432 symmetry (Fig. 1c) and an overall molecular mass of 450 kDa. The simulated images were calculated using a map derived from atomic coordinates [12] obtained by X-ray crystallography [protein data bank identification (PDB): 1IES]. The effect of embedding in solvent was modelled by subtracting 80% of the density of a similar map with a B-factor of 2000 Å2. This solvent correction affects only the low-resolution structure: its effect falls to about a third at 20 Å and is negligible by 10 Å. The 80% factor is a rough approximation of the amount of electron scattering by ice when compared with protein, although a slightly lower value of 72% was estimated previously [6]. The simulated images were generated with a dose corresponding to five electrons per Å2 and a defocus of 3 µm. The individual electrons were randomly assigned to points in the image according to a probability distribution calculated from the projection of the 3D structure after application of the contrast transfer function due to defocus. The final simulated image was then generated using a computer model that reproduces the performance of the Falcon II detector that was used to record the experimental images. In particular, a point spread function that reproduces the observed MTF was applied to each electron. The DQE of the Falcon II detector, which was 50% at half Nyquist frequency, was reproduced by assigning weights to individual electrons from a long tailed distribution fitted to the observed single event distribution of the Falcon II detector.
Fig. 1.
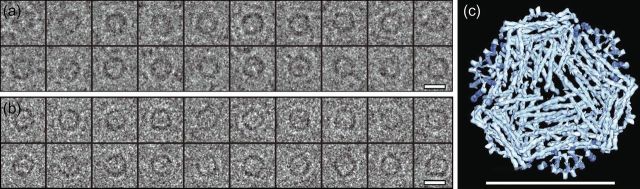
(a) Experimental and (b) simulated single-particle images of apoferritin, a 450 kDA particle that has the shape of a hollow sphere with 432 symmetry and an outside diameter of 130 Å. The experimental images were recorded on an FEI Polara G2 microscope at 300 keV using an FEI Falcon II detector with exposures of 16 el/Å2. The simulated images were calculated as described in the text, to produce single-particle images with the same pixel size (1.7 Å) and other instrumental parameters as in the experimental images, with a defocus of 3.0 μm and 4% amplitude contrast. The particle orientations are unknown for the experimental images and were randomly generated for the simulated images. (c) A surface-shaded representation of a 3D map calculated from the atomic coordinates is also shown, with rendering at a contour level that shows the α-helical segments of the structure. This 3D structure was calculated from atomic coordinates (PDB: 1IER) obtained by X-ray diffraction from a cubic crystal form of horse spleen ferritin [12]. A rough correction for the fact that the real specimen is embedded in a solvent (amorphous ice) with a density of ∼80% of that of protein was applied by subtracting from a map calculated from atomic coordinates in vacuo, another map with a B-factor of 2000 and a scale factor of 0.8.
Both the experimental and simulated images consisted of tilt pairs with the tilted partner images (not shown) having a 10° angular difference in the orientation. Tilt pair analysis [6,10] measures how accurately the particle orientations have been determined by showing how correctly the orientation differences between the pairs are clustered around the known tilt angle and tilt axis. The tilt pair parameter plot (TPPP) takes fully into account the particle symmetry and provides a reliable procedure to validate orientation that cannot mislead because the tilt angle and tilt axis are parameters that are completely independent of the method of orientation determination. Tilt pair analysis [6,10] of the experimental and simulated images of apoferritin was carried out, and the resulting TPPPs are shown in Fig. 2. There is no hint of any successful orientation determination for any of the experimental images (Fig. 2a). On the other hand, the orientation determination of the simulated images (Fig. 2b) is straightforward even with the limited number of electrons and realistic detector characteristics used in the simulations. Figure 2c–f shows the results of simulated tilt pair analysis, where the contrast in the simulated images is reduced by the application of an increasing B-factor. Finally, Fig. 2g demonstrates that orientation determination, even for simulated apoferritin images, needs the inclusion of diffraction data at around 10 Å resolution. This is about two times higher in resolution than what was found earlier to be required for other structures [6]. We believe this is due to the nature of the apoferritin structure (Fig. 1c), which can be described as a relatively smooth hollow ball of α-helices that are packed ∼10 Å apart, so that the molecular envelope does not show much structural detail until the α-helices can be resolved. From Fig. 2, it is clear that with a B-factor of 300 Å2, corresponding to a reduction in signal-to-noise level at 10 Å to 47% of theoretical, the orientations of apoferritin cannot be determined reliably.
Fig. 2.
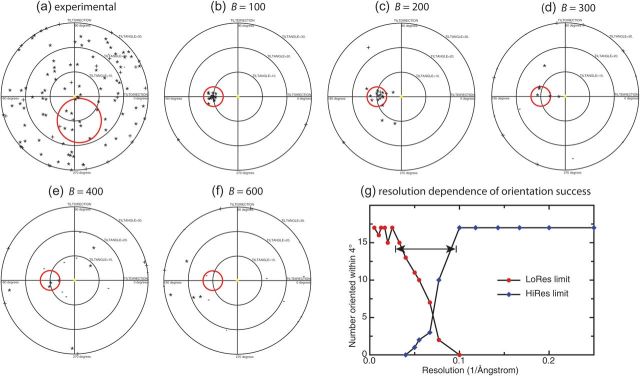
TPPPs for (a) 119 experimentally obtained tilt pairs and (b) 20 simulated image tilt pairs of apoferritin with a B-factor of 100 Å2. The red circles show the expected positions of the tilt axis and tilt angle. The inability to determine any orientations successfully from the experimental image data contrasts strongly with the excellent clustering and angular uncertainty of <2° for the simulated images. If orientations as accurate as this could be obtained with real images, it would be straightforward to determine the 3D structure. (c)–(f) TPPPs for simulated tilt pairs with B-factors from 200 to 600 Å2. A B-factor of over 300 Å2 is needed to reproduce the lack of successful orientation determination observed in the experimental images, corresponding to a signal-to-noise reduction at 10 Å to ∼33% (see text). Note that the tilt axis direction for the experimental images was roughly horizontal, whereas the simulated images had an exactly vertical tilt axis. (g) The resolution dependence of successful orientation determination based on simulated particles with a B-factor of 100 Å2. The critical resolution range for successful orientation determination can be seen to be between 30 and 10 Å.
This comparison shows that because the experimental images could not be successfully oriented, they must have <33% of the theoretically expected signal-to-noise ratio for a perfect image (i.e. 47% multiplied by the square root of the 50% DQE). We conclude that the contrast at 10 Å resolution in the current images needs to be improved by at least 2-fold before it will be possible to obtain reliable orientations. This might be done by combining improvements in detector DQE with reductions in image blurring, via improvements in either specimen preparation (e.g. thicker carbon with smaller holes) or image acquisition protocol (e.g. processing movies to remove specimen movement computationally [7,8]). In any case, it has not yet been possible to determine the 3D structure of apoferritin by cryoEM using images like those shown here.
Figure 3 shows three-dimensional colour-coded representations of the probability distribution of the orientation angles of some typical individual experimental and simulated single-particle images. Blue indicates higher and red lower probability, where the orientation angles θ and ϕ are used to create a surface that shows the result of a complete orientation search for each particle in one diagram. The clear peaks at symmetry-related views illustrate why the TPPP analysis works in the case of the simulated images (Fig. 3a–d), whereas the lack of any corresponding unambiguous peak for the experimental images illustrates why the TPPP analysis of the experimental images failed (Fig. 3e and f).
Fig. 3.

For apoferritin, colour-coded 3D representations of the log of the probability distribution of the orientation angles θ and ϕ while optimizing the third orientation parameter and the XY position of the particles are shown. Blue represents high probability and red represents low. Because apoferritin has octahedral, 432 point group symmetry, each plot shows 24 symmetry-related peaks. (a)–(d) are plots for four simulated particle images from Fig. 1(b). (e) and (f) are plots for two experimental images from Fig. 1(a). Clearly resolved symmetry-related peaks corresponding to unambiguous preferred orientations are only found for the simulated images.
There is an important caveat we should mention. Although the use of tilt pairs to demonstrate successful orientation determination has worked well for many specimens and good TPPPs were obtained previously with nine different structures ranging in molecular mass from 450 to 50 MDa [6], the resolution range needed to find the orientations of apoferritin in our simulated images is significantly higher, namely 30–10 Å rather than 100–20 Å found for previous specimens. It is, therefore, possible radiation damage to apoferritin reduces the image contrast at 10 Å resolution in the second image to below the threshold needed to obtain a reliable orientation, but the first low-dose image nevertheless has enough signal to allow its orientation to be determined. At a dose of 16 el/Å2 for each 300 keV image, we estimate from previous studies of radiation damage [5,13] that the amplitudes of the ∼10 Å diffraction should be reduced to 40% at the start of the second exposure of the tilt pair. This is still above the amplitude that the above simulations show is needed for successful orientation determination, but may make demonstrating a clear TPPP for apoferritin more difficult than for other specimens, where lower resolution Fourier components contribute more strongly to the orientation determination. One possible improvement would be to use a shorter exposure for the first image of the tilt pair, where the structure has the strongest signal and the least radiation damage, and a longer exposure for the second image, so that each image in the pair has an equal amount (50%) of integrated structural information at the critical resolution. The optimum exposure for the first and second images for a particular specimen would depend on what resolution contributed most to orientation determination, in this case at ∼10 Å.
Comparison of theoretical and experimental images of beta-galactosidase
Although experimental images of apoferritin do not appear good enough to allow orientation determination, this is not true for beta-galactosidase. This is in spite of the fact that both apoferritin and beta-galactosidase should have the same total image contrast because they have almost identical molecular masses of ∼450 kDa and, therefore, the same amount of electron scattering. The big difference is that beta-galactosidase has a very distinct structure with many surface grooves and bumps, whereas apoferritin at low resolution looks remarkably smooth resembling a hollow sphere. For apoferritin, the most significant orientation-dependent contrast, arising from the helix–helix packing of the α-helical bundles in each of the 24 subunits, appears at a resolution of around 10 Å, but for beta-galactosidase, the projections show very clear and distinct differences at much lower resolution, making it much easier to determine orientations with images of the same quality.
Figure 4a shows examples of experimental images of beta-galactosidase single particles under similar conditions to those used for apoferritin in Fig. 1. The four identical subunits of the Escherichia coli enzyme beta-galactosidase make up a particle with D2 point group symmetry. The TPPP for beta-galactosidase (Fig. 4b) shows that, using a 3D solvent-corrected map calculated from atomic coordinates (PDB: 3I3E) as a reference, most of the orientations can be determined to within ∼5°, as shown previously [6] using either an experimental cryoEM map or a map computed from atomic coordinates (Fig. 4c). As a result, it is possible using single-particle cryoEM methods to determine a reasonable 3D structure from similar quality beta-galactosidase images [6,14] and compare the amplitudes of the Fourier components in this map to those in a theoretically perfect solvent-corrected map calculated from the atomic coordinates.
Fig. 4.
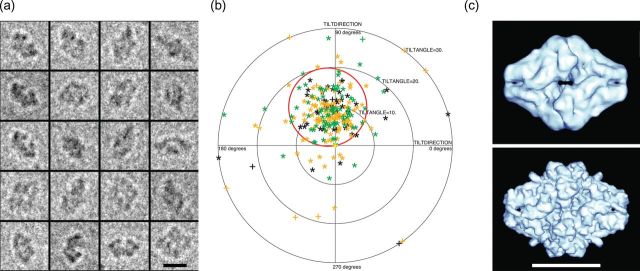
(a) Some typical experimental single-particle images of beta-galactosidase, a 450 kDa homotetrameric enzyme with D2 point group symmetry and overall dimensions of 180 × 140 × 95 Å. (b) TPPP for experimental tilt pair images showing successful orientation determination of most particle pairs. The scatter in the TPPP is 7°–8°, so the orientation error in each image is likely to be ∼5°. (c) Surface representation of 3D maps used to determine orientations, calculated from cryoEM images (top) or from atomic coordinates (PDB: 3I3E) of E. coli beta-galactosidase (bottom) [22]. Although beta-galactosidase has the same molecular weight as apoferritin, the molecular envelope has a very distinctive shape and so the orientations of beta-galactosidase can be determined using lower resolution information. In particular, good orientations can be obtained using the Fourier components in the resolution range between 100 and 25 Å [6]. This lower resolution information has much greater contrast in current images than the higher resolution information that is required to determine apoferritin orientations correctly.
Figure 5 shows a plot of the ratio of the spherically averaged experimental to theoretical amplitudes as a function of resolution. The amplitude at 10 Å is reduced to ∼3% of that expected in perfect images without radiation damage. The experimental amplitudes are damped by the MTF of the detector. In the case of the Falcon II detector, the MTF is dominated by charge diffusion in the sensitive layer, which does not markedly affect the signal-to-noise ratio or the DQE [3]. Taking into account the MTF of the Falcon II detector, a 10 Å signal at the 81 600× magnification used experimentally increases this to ∼9% of that expected. The observed amplitude will also be decreased by radiation damage that affects high resolution Fourier components more than low. However, at 10 Å resolution, this should only have a small effect, and by taking this and MTF into account, we estimate that the amplitude in the 3D map is ∼11% of that expected.
Fig. 5.

Plot of the ratio of experimental to theoretical Fourier component amplitudes as a function of resolution for a 3D map of the enzyme beta-galactosidase before (red circles) and after (blue diamonds) correction for the Falcon II detector MTF. The value at 10 Å resolution after correction is ∼10%. Radiation damage is expected to add a B-factor of ∼85 Å2 to the 3D structure because the high-resolution diffraction fades more rapidly [5,13], and cryoEM images are normally recorded with a dose that causes substantial damage. The estimated effect of radiation damage is shown (green squares), but is relatively small at 10 Å. Note that, beyond ∼8 Å resolution, the 3D map contains significant noise that causes the decay with resolution to appear to flatten out.
There is, thus, reasonable agreement between the maximum contrast estimated for the apoferritin images at 10 Å resolution (<33%) and that actually obtained for a beta-galactosidase map (∼11%), noting also that an orientational error of ∼5° would contribute to an additional blurring and contrast reduction in the 3D map of beta-galactosidase [6].
Concluding remarks
The contrast at high resolution in current experimental cryoEM single-particle images is substantially lower than expected purely from the limitations of radiation damage, the physics of the image formation process and current detector performance. This significant reduction in contrast is because of beam-induced image blurring and has a number of consequences.
For large particles such as icosahedral viruses with molecular weights of 10MDa or greater and 60-fold or greater symmetry, the loss of contrast does not significantly affect the accuracy of orientation determination because the amount of signal in each image greatly exceeds that is required [6] to determine orientations accurately. The loss in signal-to-noise can then be restored by averaging many millions of images of each asymmetric unit, which because of the high symmetry involves processing of only a modest number (20 000–50 000) of particle images. This is confirmed by a number of recent publications [15–17] which show that 3D structures of viruses can be determined at resolutions between 3 and 4 Å.
For medium-sized particles, orientations can be determined unambiguously, but at reduced accuracy. Even when higher symmetry is present, this makes it difficult to reach atomic resolution after averaging reasonable numbers of particles [18–21].
For smaller particles with molecular masses of <1 MDa, such as the 450 kDa apoferritin and beta-galactosidase molecular assemblies shown in Figures 1–5, the reduced contrast means that the orientations either cannot be determined yet (apoferritin) or have relatively low accuracy. Where orientations can be determined, the increased effective B-factor limits the resolution that can be obtained with a reasonable number (e.g. 50 000) of particles to 7–10 Å. Even a 10-fold increase in the number of particles would produce only a modest improvement in resolution [10]. Note that smaller biological structures are not expected to be any more susceptible to radiation damage than larger structures.
Realizing the full potential of cryoEM relies on obtaining better images. With better images, smaller structures could be determined reliably and larger structures could be determined at higher resolution or using fewer particles. We hope such images will be obtainable in the next few years through the use of better detectors and the development of better specimen preparation methods that help to minimize beam-induced specimen movement.
Funding
The authors' work was funded by the Medical Research Council, Grant number U105184322.
Acknowledgements
We are grateful to our colleagues for help, advice and comments on the manuscript, especially Shaoxia Chen, Wasi Faruqi, Nigel Unwin, Sjors Scheres and Kutti Vinothkumar.
References
- 1.Henderson R, Glaeser R M. Quantitative analysis of image contrast in electron micrographs of beam-sensitive crystals. Ultramicroscopy. 1985;16:139–150. doi:10.1016/0304-3991(85)90069-5. [Google Scholar]
- 2.Henderson R. Image contrast in high resolution electron microscopy of biological macromolecules : TMV in ice. Ultramicroscopy. 1992;46:1–18. doi: 10.1016/0304-3991(92)90003-3. doi:10.1016/0304-3991(92)90003-3. [DOI] [PubMed] [Google Scholar]
- 3.McMullan G, Chen S, Henderson R, Faruqi A R. Detective quantum efficiency of electron area detectors in electron microscopy. Ultramicroscopy. 2009;109:1126–1143. doi: 10.1016/j.ultramic.2009.04.002. doi:10.1016/j.ultramic.2009.04.002. [DOI] [PMC free article] [PubMed] [Google Scholar]
- 4.Glaeser R M, McMullan G, Faruqi A R, Henderson R. Images of paraffin monolayer crystals with perfect contrast: minimization of beam-induced specimen motion. Ultramicroscopy. 2011;111:90–100. doi: 10.1016/j.ultramic.2010.10.010. doi:10.1016/j.ultramic.2010.10.010. [DOI] [PMC free article] [PubMed] [Google Scholar]
- 5.Stark H, Zemlin F, Boettcher C. Electron radiation damage to protein crystals of bacteriorhodopsin at different temperatures. Ultramicroscopy. 1996;63:75–79. doi:10.1016/0304-3991(96)00045-9. [Google Scholar]
- 6.Henderson R, Chen S, Chen J Z, Grigorieff N, Passmore L A, Ciccarelli L, Rubinstein J L, Crowther R A, Stewart P L, Rosenthal P B. Tilt-pair analysis of images from a range of different specimens in single-particle electron cryomicroscopy. J. Mol. Biol. 2011;413:1028–1046. doi: 10.1016/j.jmb.2011.09.008. doi:10.1016/j.jmb.2011.09.008. [DOI] [PMC free article] [PubMed] [Google Scholar]
- 7.Brilot A F, Chen J Z, Cheng A C, Pan J H, Harrison S C, Potter C S, Carragher B, Henderson R, Grigorieff N. Beam-induced motion of vitrified specimen on holey carbon film. J. Struct. Biol. 2012;177:630–637. doi: 10.1016/j.jsb.2012.02.003. doi:10.1016/j.jsb.2012.02.003. [DOI] [PMC free article] [PubMed] [Google Scholar]
- 8.Campbell M G, Cheng A, Brilot A F, Moeller A, Lyumkis D, Veesler D, Pan J, Harrison S C, Potter C S, Carragher B, Grigorieff N. Movies of ice-embedded particles enhance resolution in electron cryo-microscopy. Structure. 2012;20:1823–1828. doi: 10.1016/j.str.2012.08.026. doi:10.1016/j.str.2012.08.026. [DOI] [PMC free article] [PubMed] [Google Scholar]
- 9.Wright E R, Lancu C V, Tivol W F, Jensen G J. Observations on the behavior of vitreous ice at ∼82 and ∼12 K. J. Struct. Biol. 2006;153:241–252. doi: 10.1016/j.jsb.2005.12.003. doi:10.1016/j.jsb.2005.12.003. [DOI] [PubMed] [Google Scholar]
- 10.Rosenthal P B, Henderson R. Optimal determination of particle orientation, absolute hand, and contrast loss in single-particle electron cryomicroscopy. J. Mol. Biol. 2003;333:721–745. doi: 10.1016/j.jmb.2003.07.013. doi:10.1016/j.jmb.2003.07.013. [DOI] [PubMed] [Google Scholar]
- 11.Henderson R. The potential and limitations of neutrons, electrons and X-rays for atomic resolution microscopy of unstained biological molecules. Quart. Rev. Biophys. 1995;28:171–193. doi: 10.1017/s003358350000305x. doi:10.1017/S003358350000305X. [DOI] [PubMed] [Google Scholar]
- 12.Granier T, Gallois B, Dautant A, d'Estaintot B L, Precigoux G. Comparison of the structures of the cubic and tetragonal forms of horse-spleen apoferritin. Acta Cryst. D. 1997;53:580–587. doi: 10.1107/S0907444997003314. doi:10.1107/S0907444997003314. [DOI] [PubMed] [Google Scholar]
- 13.Baker L A, Smith E A, Bueler S A, Rubinstein J L. The resolution dependence of optimal exposures in liquid nitrogen temperature electron cryomicroscopy of catalase crystals. J. Struct. Biol. 2010;169:431–437. doi: 10.1016/j.jsb.2009.11.014. doi:10.1016/j.jsb.2009.11.014. [DOI] [PubMed] [Google Scholar]
- 14.Chen S, McMullan G, Faruqi A R, Scheres S H W, Henderson R. High-resolution noise substitution to measure overfitting and validate resolution in 3D structure determination by single particle electron cryomicroscopy. doi: 10.1016/j.ultramic.2013.06.004. (personal communication) [DOI] [PMC free article] [PubMed] [Google Scholar]
- 15.Zhang X, Settembre E, Xu C, Dormitzer P R, Bellamy R, Harrison S C, Grigorieff N. Near-atomic resolution using electron cryomicroscopy and single-particle reconstruction. Proc. Natl. Acad. Sci. USA. 2008;105:1867–1872. doi: 10.1073/pnas.0711623105. doi:10.1073/pnas.0711623105. [DOI] [PMC free article] [PubMed] [Google Scholar]
- 16.Zhang X, Jin L, Fang Q, Hui W H, Zhou Z H. 3.3 Ångstrom cryo-EM structure of a nonenveloped virus reveals a priming mechanism for cell entry. Cell. 2010;141:472–482. doi: 10.1016/j.cell.2010.03.041. doi:10.1016/j.cell.2010.03.041. [DOI] [PMC free article] [PubMed] [Google Scholar]
- 17.Yu X K, Ge P, Jiang J S, Atanasov I, Zhou Z H. Atomic model of CPV reveals the mechanism used by this single-shelled virus to economically carry out functions conserved in multishelled reoviruses. Structure. 2011;19:652–661. doi: 10.1016/j.str.2011.03.003. doi:10.1016/j.str.2011.03.003. [DOI] [PMC free article] [PubMed] [Google Scholar]
- 18.Schuette J C, Murphy F V, Kelley A C, Weir J R, Giesebrecht J, Connell S R, Loerke J, Mielke T, Zhang W, Penczek P A, Ramakrishnan V, Spahn C M T. GTPase activation of elongation factor EF-Tu by the ribosome during decoding. EMBO J . 2009;28:755–765. doi: 10.1038/emboj.2009.26. doi:10.1038/emboj.2009.26. [DOI] [PMC free article] [PubMed] [Google Scholar]
- 19.Cong Y, Baker M L, Jakana J, Woolford D, Miller E J, Reissman S, Kumar R N, Redding-Johanson A M, Batth T S, Mukhopadhyay A, Ludtke S J, Frydman J, Chiu W. 4.0-Ångstrom resolution cryo-EM structure of the mammalian chaperonin TRiC/CCT reveals its unique subunit arrangement. Proc. Natl. Acad. Sci. USA. 2010;107:4967–4972. doi: 10.1073/pnas.0913774107. doi:10.1073/pnas.0913774107. [DOI] [PMC free article] [PubMed] [Google Scholar]
- 20.Zhang Q, Dai X, Cong Y, Zhang J, Dougherty M, Chen D-H, Wang J, Ludtke S J, Chiu W. Cryo-EM structure of a molluscan hemocyanin suggests its allosteric mechanism. Structure. 2013 doi: 10.1016/j.str.2013.02.018. (submitted) [DOI] [PMC free article] [PubMed] [Google Scholar]
- 21.Mills D, Vitt S, Strauss M, Shima S, Vonck J. De novo modelling of the F420-reducing-dehydrogenase from a methanogenic archaeon by cryo-electron microscopy. eLIFE. 2013 doi: 10.7554/eLife.00218. (in press) [DOI] [PMC free article] [PubMed] [Google Scholar]
- 22.Dugdale M L, Dymianiw D L, Minhas B K, D'Angelo I, Huber R E. Role of Met-542 as a guide for the conformational changes of Phe-601 that occur during the reaction of β-galactosidase (Escherichia coli) Biochem. Cell Biol. 2010;88:861–869. doi: 10.1139/O10-009. doi:10.1139/O10-009. [DOI] [PubMed] [Google Scholar]