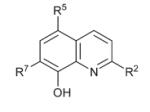
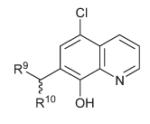
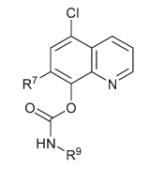
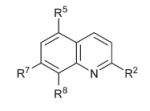
Table 1.
Oxine derivatives: MetAP and HUVEC assay results
| IC50,a μM |
|||||
|---|---|---|---|---|---|
| Entry | Substituents (when not specified, R# = H) | hMetAP1 | hMetAP2 | HUVEC | |
| 1 |

|
— | >15 | 2.03 ± 0.3 | 6.21 ± 1.1 |
| 2 | R2 = Me | >15 | >15 | 2.70 ± 0.61 | |
| 3 | R2 = CN | >15 | >15 | >50 | |
| 4 | R5 = Cl (Cloxyquin) | 12.9 ± 1.0 | 1.27 ± 0.6 | 1.41 ± 0.1 | |
| 5 | R5 = NO2 (Nitroxoline) | >15 | 0.055 ± 0.02 | 1.90 ± 0.3 | |
| 6 | R5 = SO3H | >15 | >15 | >50 | |
| 7 | R5 = Cl, R7 = I (Clioquinol) | >15 | 2.39 ± 0.31 | 2.42 ± 0.5 | |
| 8 | R5 = Cl, R7 = Br | >15 | >15 | 2.21 ± 0.6 | |
| 9 | R5, R7 = Cl | >15 | >15 | 3.64 ± 0.53 | |
| 10 | R5, R7 = Br | >15 | >15 | 2.53 ± 0.71 | |
| 11 | R5, R7 = I | >15 | >15 | 2.62 ± 0.08 | |
| 12 | R7 = CH2N(CH2CH2)2O | >50 | >15 | >20 | |
| 13 |

|
R9 = N(CH2CH2OH)2 | >50 | >15 | 10.73 ± 0.2 |
| 14 | R9 = N(CH2CH2)2CH2 | >50 | 7.68 ± 1.2 | 13.51 ± 1.4 | |
| 15 | R9 = N(CH2CH2)2O | >50 | 2.66 ± 0.2 | 5.57 ± 0.16 | |
| 16 | R9 = N(CH2CH2)2N–Me | >50 | 3.81 ± 0.74 | 9.56 ± 0.8 | |
| 17 | R9 = N(CH2CH2)2NPh(4-OMe) | >15 | >15 | 1.46 ± 0.33 | |
| 18 | R9 = N(CH2CH2)2O, R10 = Ph | 14.01 ± 0.8 | 0.33 ± 0.05 | 1.92 ± 0.6 | |
| 19 | R9 = NH-2-thiazolyl, R10 = 2-furanyl | >50 | 2.75 ± 0.4 | 2.53 ± 0.13 | |
| 20 |

|
R9 = CH2CH2Cl | >15 | 0.365 ± 0.04 | 2.11 ± 0.25 |
| 21 | R7 = Cl, R9 = CH2CH2Cl | >15 | >15 | 2.62 ± 0.5 | |
| 22 | R9 = Ph | >15 | 5.26 ± 0.6 (b = 24%) | 1.21 ± 0.51 | |
| 23 | R9 = −(3,5-difluoro)Ph | >15 | >15 | 2.20 ± 0.1 | |
| 24 | R9 = −(3,5-dichloro)Ph | >15 | 0.024 ± 0.007 | 0.324 ± 0.06 | |
| 25 | R7 = Cl, R9 = −(4-fluoro)Ph | >15 | >15 | 3.58 ± 0.9 | |
| 26 |

|
R5 = Cl, R8 = OPO(OEt)2 | >15 | >15 | >50 |
| 27 | R5 = Cl, R8 = OCH2CH=CH2 | >15 | >50 | >50 | |
| 28 | R5, R7 = Cl, R8 = OCH2CH=CH2 | >15 | >15 | 2.32 ± 0.23 | |
| 29 | R5 = Cl, R8 = OCH2CH2OH | >15 | >15 | 2.40 ± 0.3 | |
| 30 | R2 = CN, R8 = OCH2CH=CH2 | >15 | >15 | >50 | |
| 31 | R8 = NH2 | >15 | >15 | >50 | |
| 32 | R8 = NHSO2-(4-Me)Ph | 6.97 ± 0.25 (b = 21%) | >15 | 0.308 ± 0.04 | |
IC50 values are the average of at least three independent experiments consisting of triplicates and ± standard deviation is given. b= the bottom value in the dose–response curve, noted in parentheses only when it was above 15%.
