
Table 2.
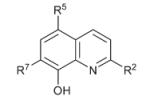
Nitroxoline analogs: MetAP and HUVEC assays
| IC50,a μM |
|||||
|---|---|---|---|---|---|
| Entry | Substituents (when not specified, R# = H) | hMetAP1 | hMetAP2 | HUVEC | |
| 5 |
|
R5 = NO2 (Nitroxoline) | >15 | 0.055 ± 0.02 | 1.90 ± 0.3 |
| 33 | R5 = NO | >15 | >50 | 0.364 ± 0.2 | |
| 34 | R5 = NH2 | 8.92 ± 1.2 | 11.88b ± 1.1 (b = 26%) | 0.218 ± 0.04 | |
| 35 | R5 = N(CH2CH3)2 | 7.21 ± 1.3 (b = 29%) | 20.13b ± 2.2 (b = 25%) | 0.329 ± 0.17 | |
| 36 | R5 = N([CH2]5CH3)2 | >40 | >40 | 0.789 ± 0.21 | |
| 37 | R5 = N(CH2(4-OMe)Ph)2 | 1.46 ± 0.3 (b = 32%) | >40 | 0.551 ± 0.08 | |
| 38 | R5 = NHCOCH3 | >40 | >40 | 10.2 ± 1.1 (b = 28%) | |
| 39 | R5 = NHCO(CH2)4CH3 | >40 | >40 | 8.45 ± 0.91 | |
| 40 | R5 = NHCOPh | 6.45b ± 1.1 | >40 | 0.789 ± 0.11 | |
| 41 | R5 = NHSO2CH(Me)2 | >40 | >40 | 12.94 ± 0.13 | |
| 42 | R5 = NHCON(CH2CH2)2O | >40 | >40 | 1.88 ± 0.3 | |
| 43 | R2 = CH3, R5, R7 = NO2 | 17.31 ± 1.7 | >15 | 15.74 ± 1.3 | |
| 44 | R5 = Cl, R7 = NO2 | >15 | >15 | 7.73 ± 0.77 | |
| 45 | R5 = Cl, R7 = NH2 | >40 | >15 | 0.273 ± 0.07 | |
| 46 |
|
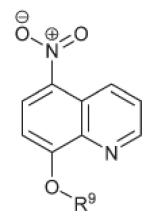
R9 = COC(Me)3 | >15 | 0.434 ± 0.1 | 1.6 ± 0.05 |
| 47 | R9 = PO(OPh)2 | >15 | 0.117b ± 0.07 | 2.01 ± 0.06 | |
| 48 | R9 = SO2N(Me)2 | >15 | 0.057 ± 0.015 | 0.77 ± 0.1 | |
| 49 | R9 = CH2CO2Et | >15 | >15 | 7.3 ± 0.81 | |
| 50 | R9 = CH2CONH2 | >15 | 1.057 ± 0.5 | 6.3 ± 1.4 | |
| 51 |
|
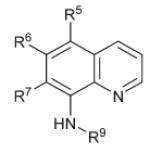
R5 = Cl | >40 | >15 | 0.721 ± 0.3 |
| 52 | R7 = Cl | >40 | >15 | 1.66 ± 0.06 | |
| 53 | R5 = Cl, R6 = OMe | >40 | >15 | >20 | |
| 54 | R5 = NO, R9 = SO2(4-Me)Ph | 10.51 ± 0.9 (b = 18%) | >15 | 0.204 ± 0.02 | |
| 55 | R5 = NO2, R9 = SO2(4-Me)Ph | 21.05b ± 1.8 (b = 19%) | >15 | 0.305 ± 0.07 | |
a
IC50 values are the average of at least three independent experiments with each consisting of triplicates and ± standard deviation is given.
b
The curve was non-sigmoidal. b = the bottom value in the dose-response curve, given in parentheses only when it was above 15%.