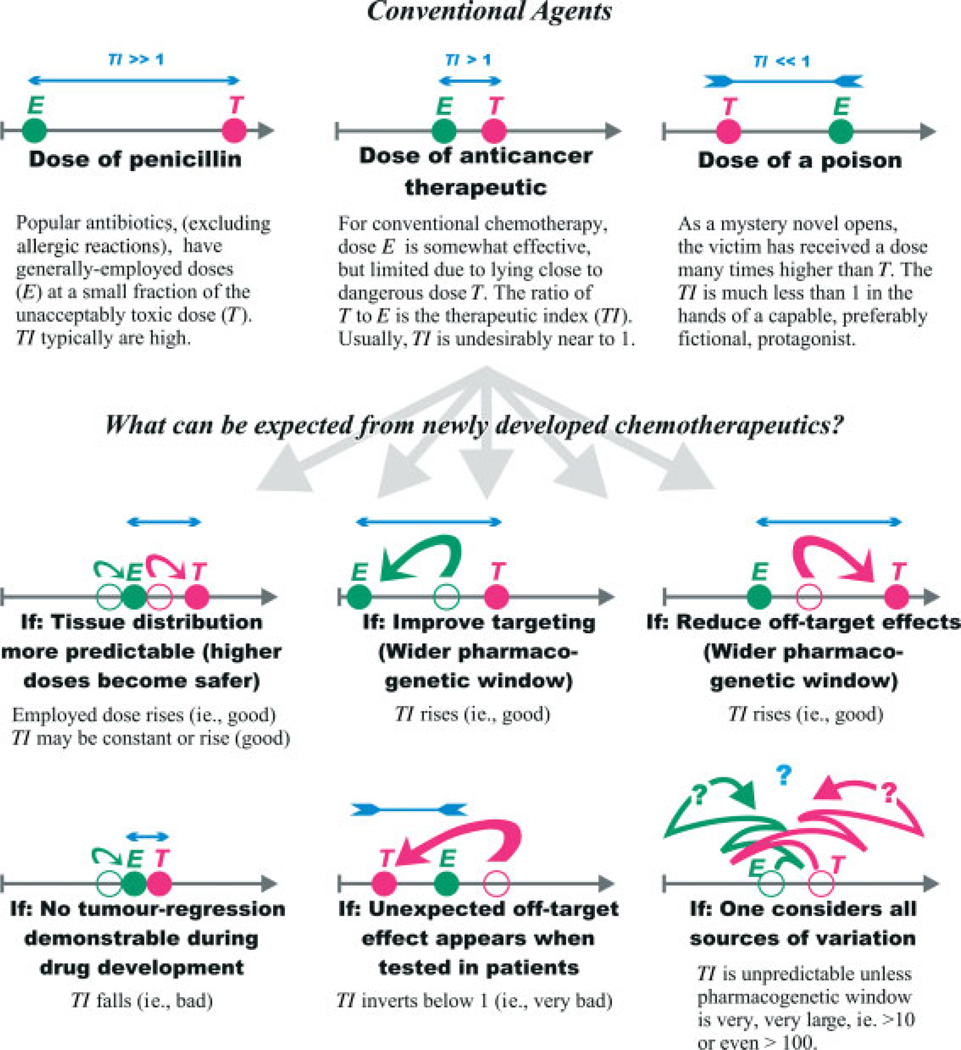
Figure 1.
A schematic diagram of variables affecting therapeutic success and failure. The grey arrow represents a spectrum of administered doses, from no treatment at the left endpoint to a very high dose on the right. Filled circles indicate the dose (green for the generally-employed dose E, red for the minimal dose T giving unacceptable toxicity) chosen after considering the illustrated variable. Open circles, baseline doses that might have been assumed in ignorance of the same variable.

