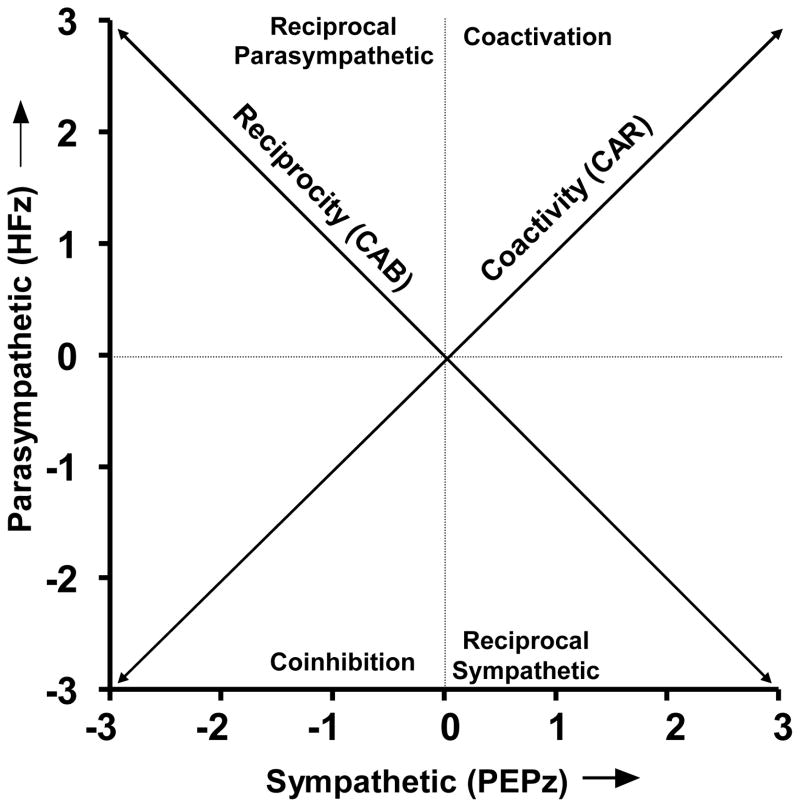
Figure 1.
Bivariate representation of autonomic space, with a parasympathetic ordinate (estimated by normalized HF) and a sympathetic abscissa (estimated by normalized PEP). The 0,0 intersection illustrates the mean position along both dimensions, the diagonal of reciprocity represents a bipolar, model of reciprocally controlled autonomic divisions. The diagonal of coactivity illustrates another dimension of regulation, which more effectively indexes the aggregate or total autonomic activity. The axes and quadrants of this graphic represent the major modes of autonomic control as defined by Berntson et al., 1991. The locations along the parasympathetic and sympathetic axes represent patterns of independent parasympathetic and sympathetic control, respectively. The quadrants represent the remaining four modes of control (reciprocal parasympathetic, reciprocal sympathetic, coactivation and coinhibition.

