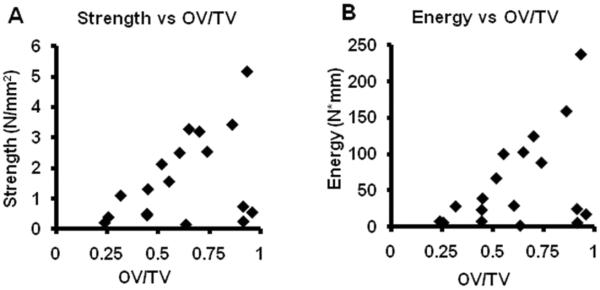
Figure 9.

Correlation between μCT OV/TV and mechanical testing results. Panel A shows the correlation between pull-out strength and μCT OV/TV (r=0.401, p=0.049). Panel B shows the correlation between pull-out energy to failure and μCT OV/TV (r=0.435, p=0.035).
