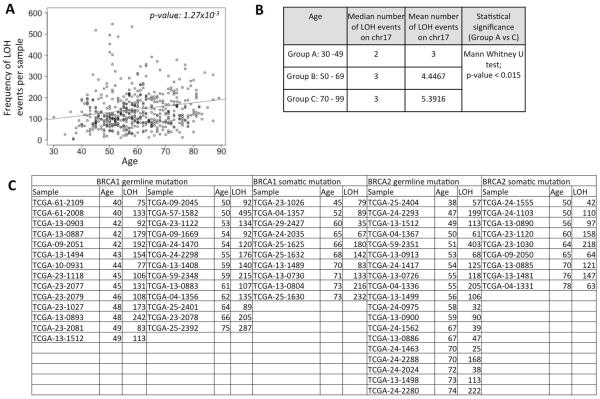
Figure 1.
A) Scatterplot showing the distribution of loss of heterozygosity (LOH) frequency for the patients in the TCGA cohort against their age. The trend line for regression is shown in dark grey. The p-value is shown at the top right corner. B) Frequency of LOH events affecting chr17 in patients of different age group. C) LOH frequency in patients with germ line or somatic mutations in BRCA1 or BRCA2. TCGA-13-1512 had germ line mutation in both BRCA1 and BRCA2.

