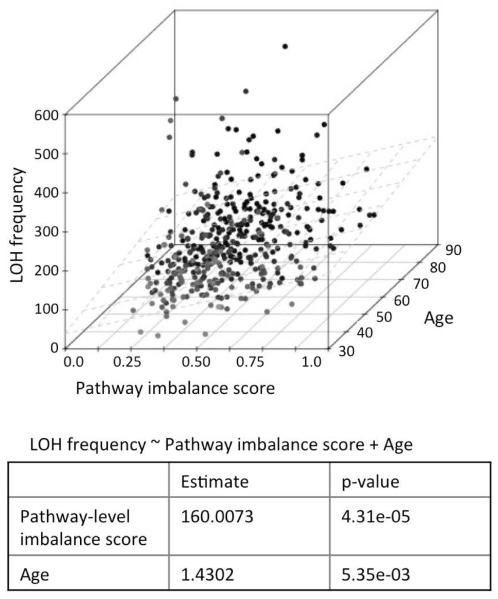
Figure 4.
3D scatter plot showing joint distribution of the frequency of loss of heterozygosity (LOH) events per sample with the pathway imbalance score and age at diagnosis of the patients. The regression plane (LOH ~ pathway imbalance score + Age) is shown in light grey. In the 3D plot, darker points are further away compared to those with a lighter shade.

