
Figure 1.
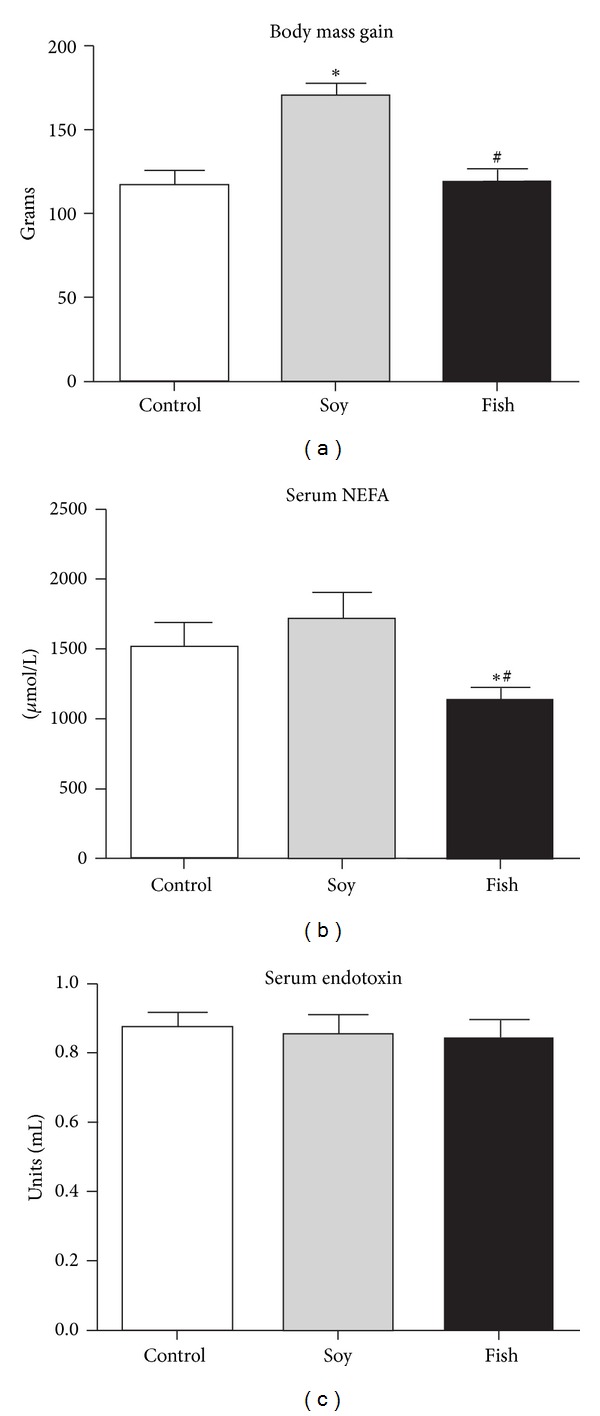
Body mass gain (a) and serum levels of nonesterified fatty acids (b) and endotoxin (c) of rats fed with control (n = 6), soy (n = 5), or fish diet (n = 8). *P < 0.05 versus control; # P < 0.05 soy versus fish.
Official websites use .gov
A
.gov website belongs to an official
government organization in the United States.
Secure .gov websites use HTTPS
A lock (
) or https:// means you've safely
connected to the .gov website. Share sensitive
information only on official, secure websites.
Body mass gain (a) and serum levels of nonesterified fatty acids (b) and endotoxin (c) of rats fed with control (n = 6), soy (n = 5), or fish diet (n = 8). *P < 0.05 versus control; # P < 0.05 soy versus fish.