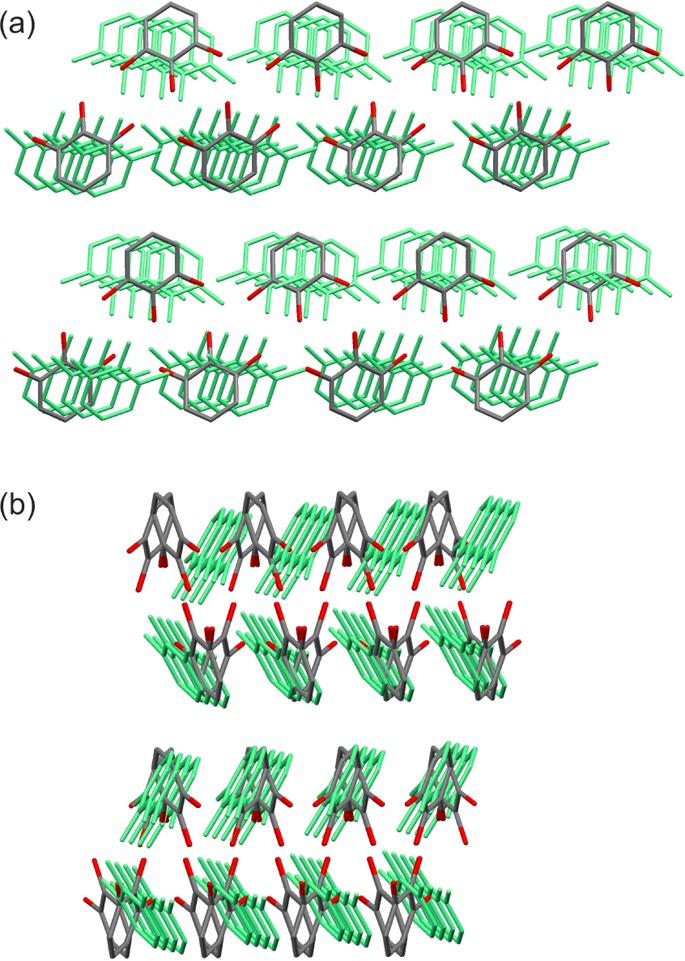
Figure 13.

Overlay of the experimental (colored by element) and the hypothetical structure (light green), which is closest in energy [1, Figure 10a; Table S9a of the Supporting Information: label 85_C2(1)], viewed along the (a) experimental [010] and (b) experimental [001], the C11(6) chain axis.
