Figure 3.
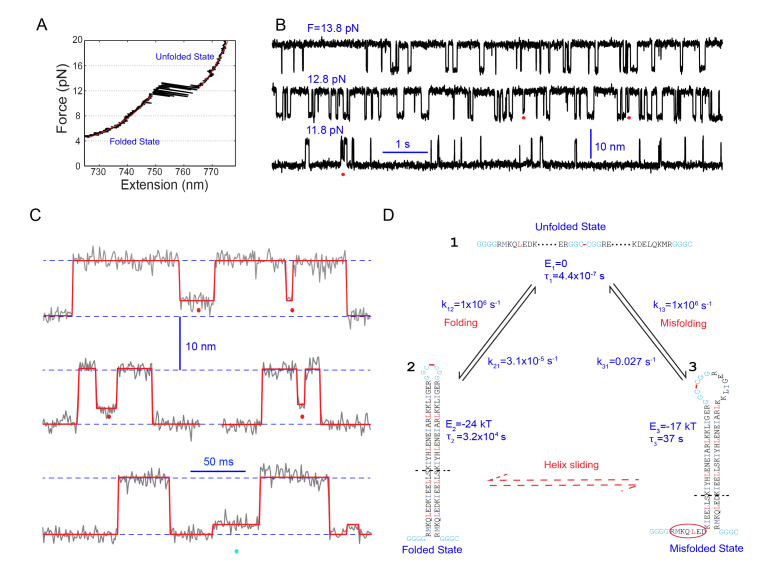
Formation of staggered coiled coil states through protein misfolding and helix sliding. (A) Force-extension curve (FEC, black) of a single coiled coil complex (pIL) showing reversible two-state transitions at ~12 pN. The FEC regions corresponding to the fully folded and unfolded protein states can be fitted by the worm-like chain model (red lines). (B) Time-dependent extension traces exemplifying two-state transitions of pIL at the indicated pulling forces. Red dots indicate the partially folded and staggered states. (C) Close-up view of the extension traces showing the misfolded states (red dots) and intermediate state (cyan dots). (D) Quantitative model for folding and misfolding of pIL at zero force. One of three misfolded states is shown here, which contains staggered helices with shifted registry. The free energy (E) and lifetime (τ) of different states and their transition rates (k) are indicated.

