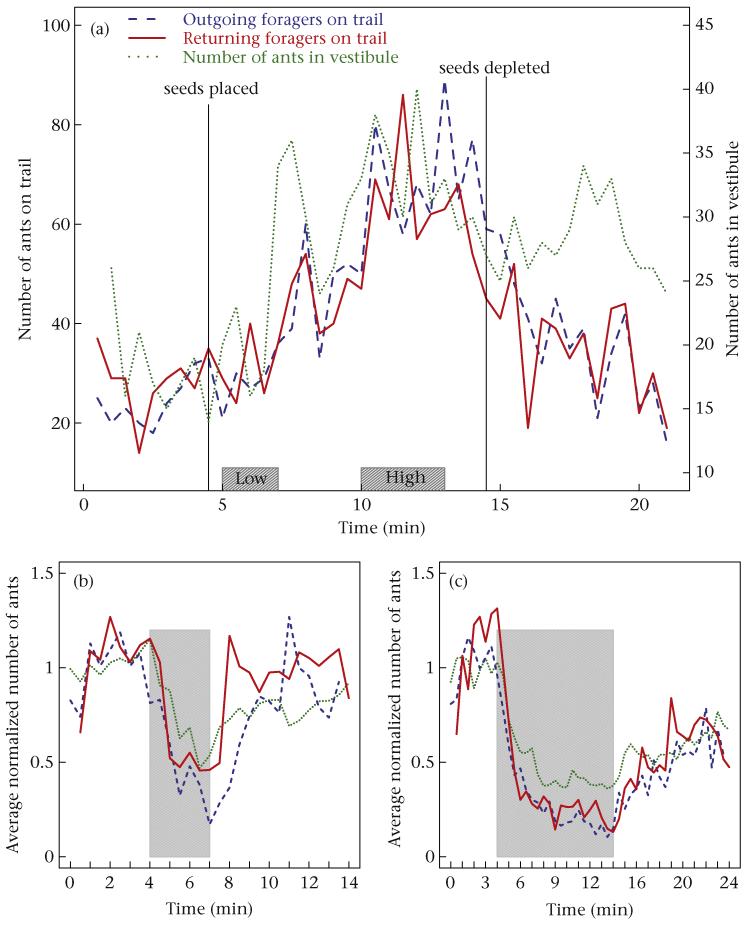
Figure 3.
(a) Number of returning and outgoing foragers on the trail and number of ants inside the vestibule for colony 486 in experiment 1; boxes indicate the low and high forager return rate periods; solid vertical lines indicate the times at which seeds were placed on the trail and depleted by the ants. (b, c) Average normalized number of returning and outgoing foragers on the trail and number of ants inside the vestibule for 3 min removals (N = 10) and 10 min removals (N = 12), respectively, in experiment 2; grey shading indicates the time during which returning foragers were prevented from returning to the nest.

