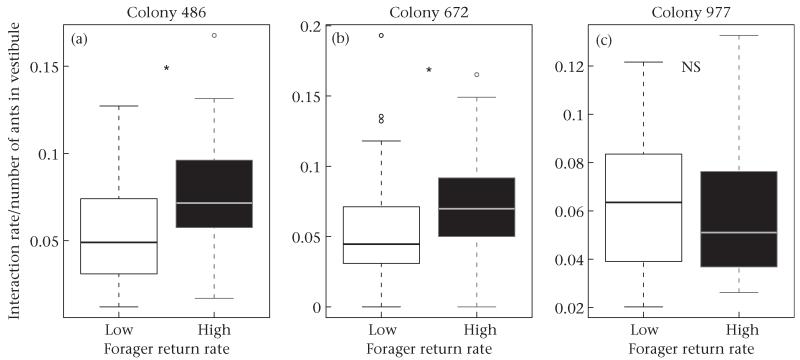
Figure 4.
Difference in interaction rate divided by the number of ants in the vestibule between low (white bars) and high (black bars) forager return rate periods for the three colonies in experiment 1. Boxes indicate the lower and upper quartiles; horizontal lines within boxes indicate the median, whiskers extend to the 1.5 interquartile range from the box, and points indicate outliers.

