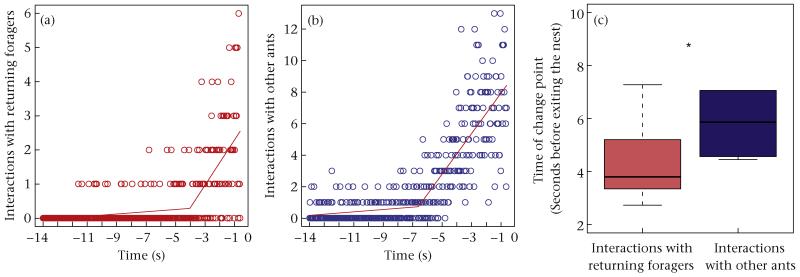
Figure 5.
Total number of interactions with (a) returning foragers and (b) other ants at each video frame (1/30 s) before an ant left the nest, in colony 486 for the period of high forager return rate. Lines are the piecewise linear regressions. Time zero indicates when an ant left the nest and all preceding times are when it was in the vestibule. (c) Difference between the change point for interactions with returning foragers and with other ants; all colonies and foraging rate periods pooled. Boxes indicate the lower and upper quartiles; horizontal lines within boxes indicate the median, and whiskers extend to the 1.5 interquartile range from the box.

