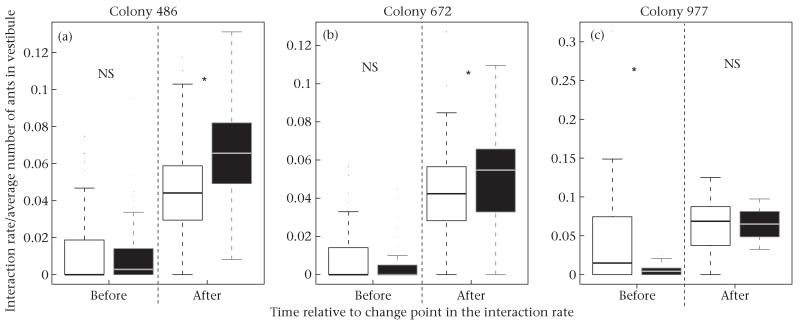
Figure 7.
Difference between the low (white) and high (black) forager’ return rate periods in outgoing foragers’ interaction rate before and after the change point. Boxes indicate the lower and upper quartiles; horizontal lines within boxes indicate the median, whiskers extend to the 1.5 interquartile range from the box, and points indicate outliers.

