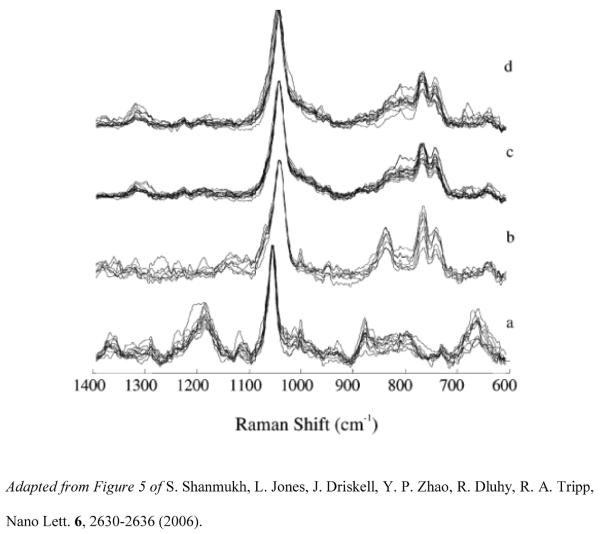
Figure 3.
SERS spectra of the RSV strains (a) strain A/Long (A/Long), (b) strain B1 (B1), (c) strain A2 with a G gene deletion (ΔG), and (d) strain A2 (A2), collected from several spots on multiple substrates and normalized to the peak intensity of the most intense band (1045 cm−1) and overlaid to illustrate the reproducibility on the Ag nanorod substrate.

