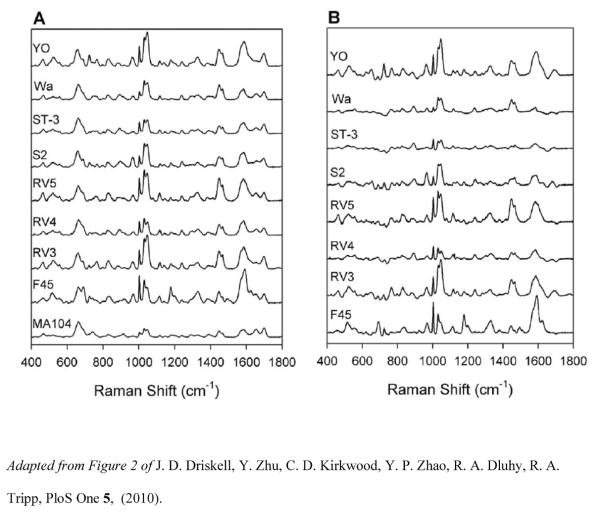
Figure 4.
Rotavirus SERS spectra. (A) Average SERS spectra for eight strains of rotavirus and the negative control (MA104 cell lysate). Spectra were baseline corrected, normalized to the band at 633cm−1, and offset for visualization. (B) Difference SERS spectra for eight strains after subtraction of MA104 spectrum.

