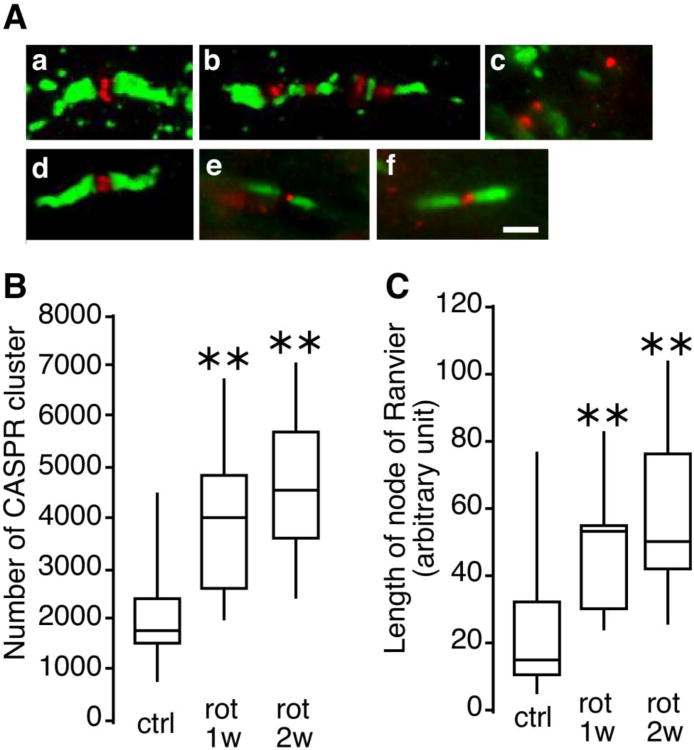
Fig. 2. Shape of the node of Ranvier and characterization of CASPR clusters in the rat optic nerve.
Thin sections (5μm) of rat optic nerves were stained with antibodies against CASPR (green) and sodium channels (NaV1.6, red) to reveal nodes of Ranvier. A, representative images of the node of Ranvier observed by three dimensional confocal microscopy. a, a typical image of the normal node of Ranvier (observed in control animals). b, an elongated node of Ranvier (observed at 2 weeks after rotenone injection). c, a totally disorganized node of Ranvier (observed at 12 weeks after rotenone injection). d, e, and f, representative patterns of the node of Ranvier from animals that received AAV2-NDI1, respectively, 2 week, 3 weeks, and 4 weeks after rotenone injection. Scale bar = 2 μm. B, the number of CASPR clusters counted in optic nerve sections and compiled in a box plot. C, the length of the node of Ranvier evaluated and compiled in a box plot. For B and C the evaluation was performed on 3 different animals per group. 32 sections of the left and right optic nerves were used per animal ** p<0.01 (one way ANOVA).

