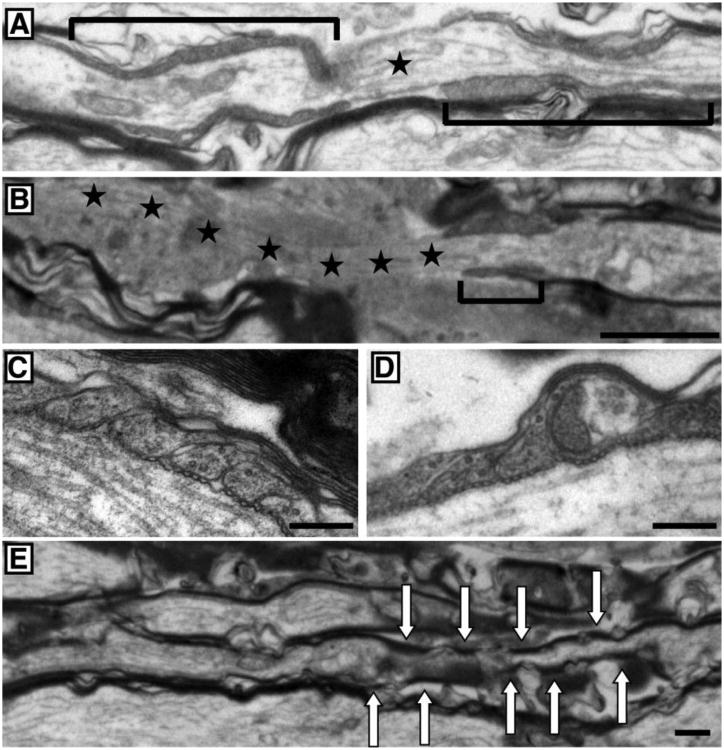
Fig. 3. Ultra structure of the node of Ranvier.
Representative images of sagittal sections of the rat optic nerve observed under electron microscope are displayed. A and B, the nodal region from a control group (A) and a group treated with rotenone for 4 weeks (B). The brackets denote the paranodal region surrounding the node of Ranvier. The stars mark the node of Ranvier (uncovered portion of the axon). In the rotenone-treated group, a smaller paranode region indicating a thinner myelin is seen and a mirrored paranode section was not observed resulting in a large region of uncovered axon (stars). C and D, the paranodal ending loops of the myelin sheath from a control group (C) and a group treated with rotenone for 4 weeks (D). E, the nodal region from a group treated with rotenone for 4 weeks illustrating discontinued myelination of an axon (highlighted by arrows). Scale bar = 1μm for A, B and E and 250nm for C and D.

