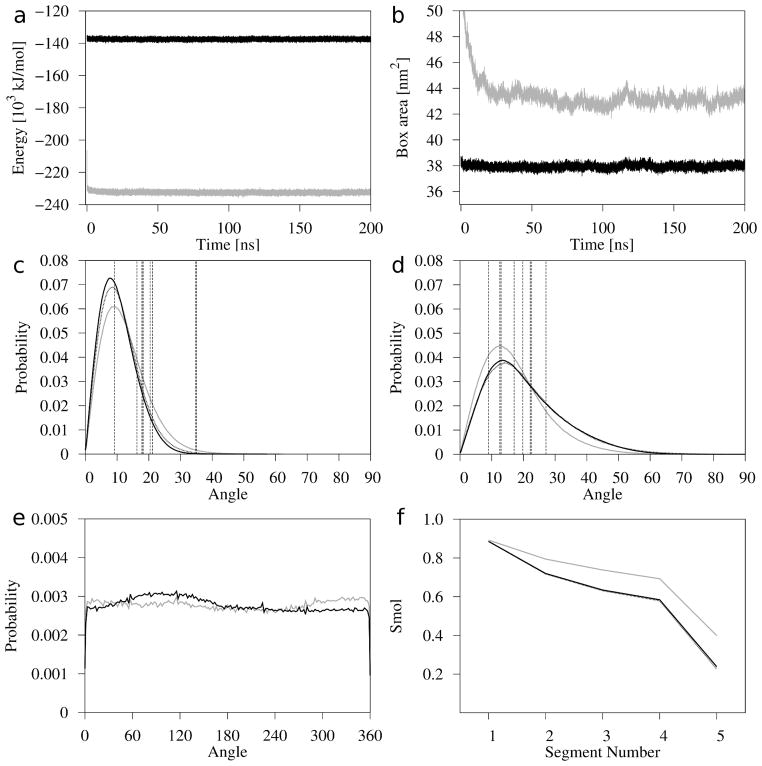
Figure 3.
Time profiles of the bilayer potential energy (a) and the simulation box surface area (b) along respective MD trajectories; distributions of tilt (θ) angles for Chol rings (c) and chains (d); distribution of azimuthal (ϕ) angles for Chol rings (e); and the molecular order parameter (Smol) profiles calculated for the Chol chains (f), for the Chol (black line), Chol-2 (black dotted line, c, d, and f), and POPC-Chol50 (gray line) bilayers. The vertical dashed lines in (c) and (d) represent tilts of the ring (c) and chain (d) of each of the eight Chol molecules in the unit cell of the anhydrous Chol crystal 20.

