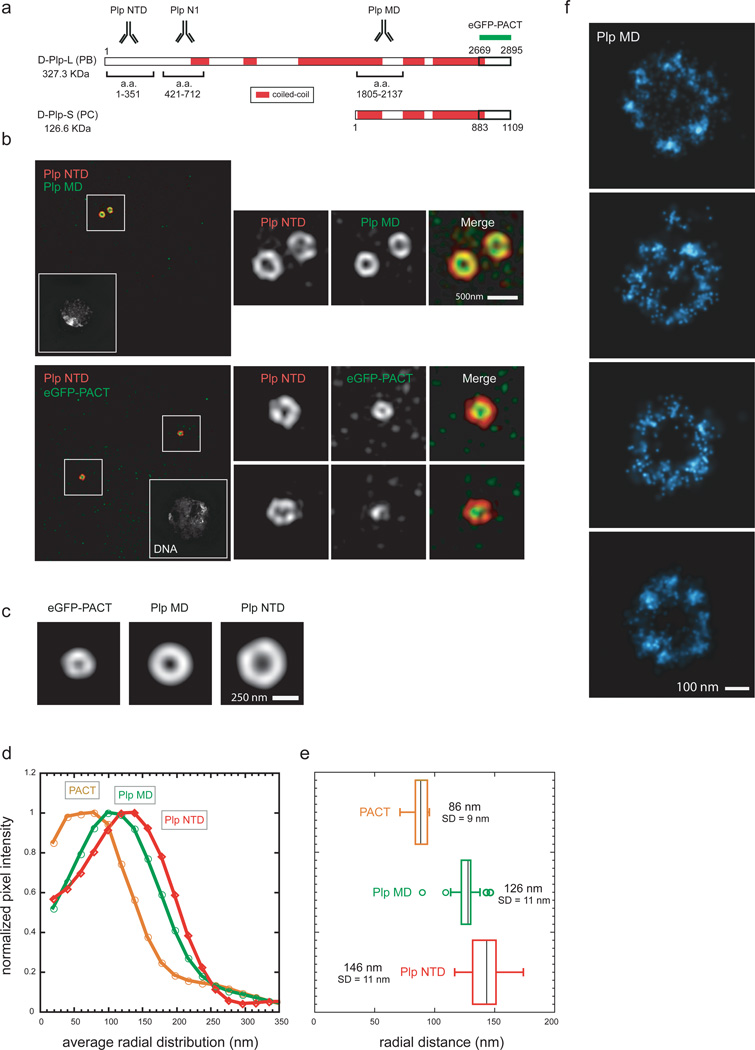
Figure 2. The molecular architecture of Pericentrin-like protein.
a) Amino-acid map of Drosophila Plp predicted from the Flybase database. Sequence prediction of coiled-coil conformation was performed with the software Coils using a window of 28 residues. Amino-acid stretches were considered coiled-coil if predicted with a probability of ≥70%.
b) Top: Wild type S2 cells co-stained with rabbit anti-Plp MD primary antibodies (a.a 1805–2137, anti-rabbit Alexa 488) and with guinea pig anti-Plp NTD primary antibodies (a.a. 1–381, anti-guinea pig Alexa 555).
Bottom: S2 cells expressing eGFP-PACT co-stained with mouse anti-eGFP monoclonal antibody (anti-mouse Alexa 488) and with rabbit anti-Plp NTD primary antibodies (a.a. 1–381, anti-rabbit Alexa 555). DNA is labeled with DAPI stain. Scale bar 1µM.
c) 2D projections of the average aligned volumes. Plp NTD=82; Plp MD n=29; eGFP-PACT n=9.
d) Fluorescence intensity profiles from the center of the centriole image outward measured from radially averaged 2D projections of average volumes of centrosomal proteins.
e) Radially averaged fluorescence intensities values obtained from individual centrosomal protein projected volumes were fit to an offset Gaussian to calculate the center position and deviation of the distribution. Scale bar 200 nm.
f) STORM image of centrioles from S2 cells stained with rabbit anti-Plp MD antibody (a.a 1805–2137) and anti-rabbit secondary antibodies conjugated with Alexa 647/Alexa 405 dye pairs.

