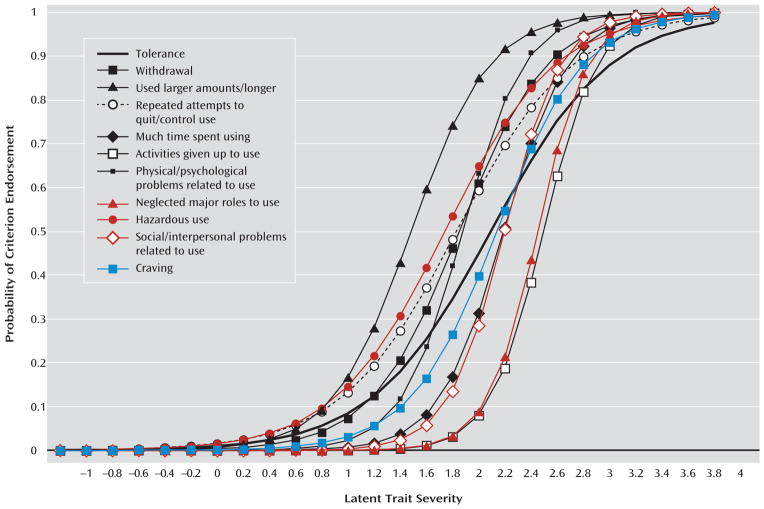
FIGURE 2. Information Characteristic Curves from Item Response Theory Analysis of DSM-IV Alcohol Abuse and Dependence Criteria, Required to Persist Across 3 Years of Follow-Upa,b.
a Red curves: DSM-IV abuse criteria. Black curves: DSM-IV dependence criteria. Blue curve: Craving.
b Data from the National Epidemiologic Survey on Alcohol and Related Conditions (NESARC), Wave 2 (2004–2005), conducted by the National Institute on Alcohol Abuse and Alcoholism. Participants were noninstitutionalized civilians age 20 years and older (N=34,653). The NESARC had a multistage design and oversampled blacks, Hispanics, and young adults. Analyses were conducted with Mplus (version 6.12, Los Angeles, Muthén & Muthén, 2011) and incorporated sample weights to adjust standard errors appropriately. See supplementary Table S2 for more detail on this analysis.

