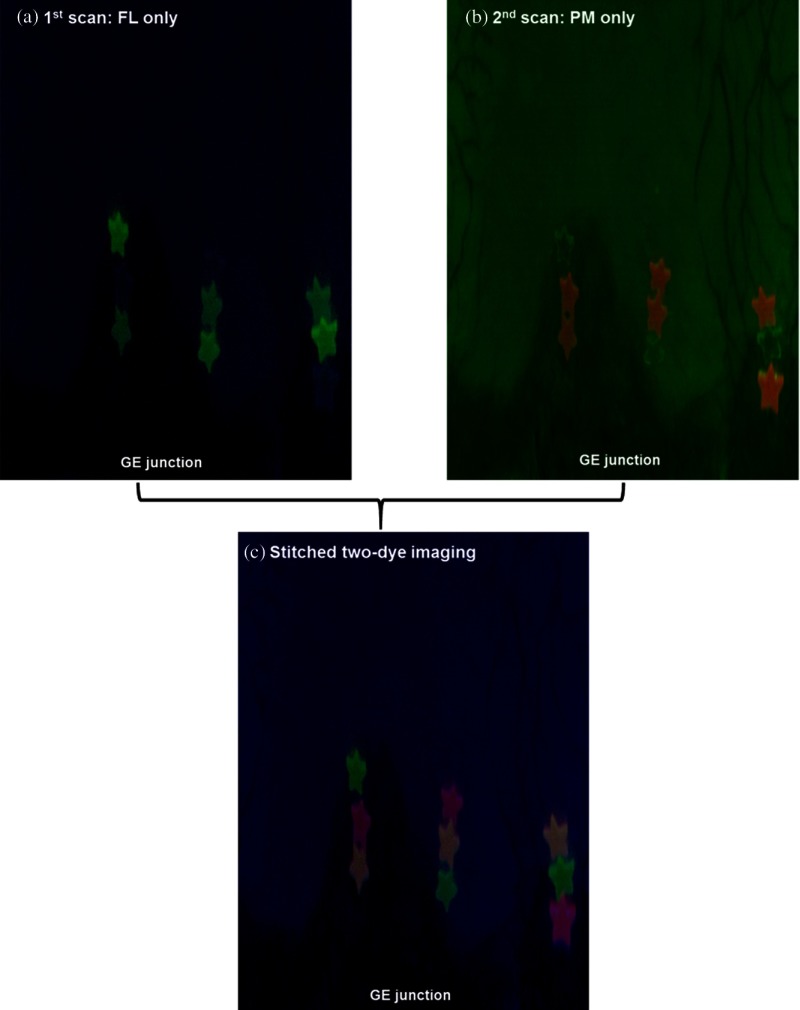
Fig. 7.
(a) The stitched and unwrapped 2-D map for the FL imaging. It comprised the blue reflectance images shown as the background with the FL green fluorescent hotspots. (b) The 2-D stitched map for the PM imaging. It is comprised of the green reflectance image in the background with the PM red fluorescent hotspots. (c) The combined stitched map is shown. Only the FL fluorescence is shown in the green display channel and the PM fluorescence in the red display channel. The FL-PM two-dye targets are shown as orange.

