Abstract
Multivariate pattern analysis (MVPA) methods such as support vector machines (SVMs) have been increasingly applied to fMRI and sMRI analyses, enabling the detection of distinctive imaging patterns. However, identifying brain regions that significantly contribute to the classification/group separation requires computationally expensive permutation testing. In this paper we show that the results of SVM-permutation testing can be analytically approximated. This approximation leads to more than a thousand fold speed up of the permutation testing procedure, thereby rendering it feasible to perform such tests on standard computers. The speed up achieved makes SVM based group difference analysis competitive with standard univariate group difference analysis methods.
Keywords: SVM, Statistical inference, Neuroimaging analysis
1. Introduction
Statistical parametric mapping (R.S.J. Frackowiak, 1997), voxel-based morphometry (Ashburner and Friston, 2000; Davatzikos et al., 2001) and related methods that apply voxel-wise statistical tests have been fundamental tools in modern neuroimaging. These methods have made it possible to quantify group differences and understand spatial patterns of functional activation/brain structure. Methods belonging to this family of mass-univariate methods are amenable to standard statistical inference techniques. Typically these methods associate a statistical significance measure such as a ’p-value’ with every voxel. This allows for easy interpretation of the output from these methods. However, during the past decade, the neuroimaging community has recognized that multi-variate relationships among different brain regions cannot be captured by univariate analysis alone. This has lead to the development of multi-variate image analysis methods, which provide a more complete picture of imaging patterns that relate to brain activity, structure and pathology (Fan et al., 2007; Klöppel et al., 2008; Wang et al., 2007; Venkataraman et al., 2012; Langs et al., 2011; Davatzikos et al., 2005; Mouro-Miranda et al., 2005; Xu et al., 2009; Craddock et al., 2009; De Martino et al., 2008; Cuingnet et al., 2011; Fan et al., 2007; Koutsouleris et al., 2009; Vemuri et al., 2008; Sabuncu and Van Leemput, 2011; Venkataraman et al., 2012; Richiardi et al., 2011; Mingoia et al., 2012; Pereira et al., 1998). Among the most successful such methods are SVM-based tools (Klöppel et al., 2008; Fan et al., 2007), which have been quite widely used in functional (Wang et al., 2007; Davatzikos et al., 2005; Mouro-Miranda et al., 2005; Craddock et al., 2009; De Martino et al., 2008) and structural (Klöppel et al., 2008; Cuingnet et al., 2011; Fan et al., 2007; Koutsouleris et al., 2009; Vemuri et al., 2008) neuroimaging analysis.
However, interpretation of SVM models is difficult because unlike univariate methods (Ashburner and Friston, 2000), SVMs do not naturally provide statistical tests (and corresponding p-values) associated with every voxel/region of an image. Rather, it is considered normal to evaluate these models as ”black boxes” on the basis of cross-validation accuracy, which is a measure of how accurately they detect the presence of disease based on data from an image. While cross-validation provides an overall estimate of the separability between two groups or conditions, it is unclear how each brain region contributes to the construction of the multivariate discriminatory pattern that ultimately drives the detection of disease. Further, while SVM models associate a ’weight coefficient’ with every voxel/region of the image space they do not offer an analytic framework for estimating statistical significance of these weights, an issue of fundamental importance. Hence permutation tests have typically been used to understand what regions of the brain drive the SVM decision (Mouro-Miranda et al., 2005; Wang et al., 2007). These permutation tests are extremely expensive computationally. Hence they are largely prohibitive in many practical applications. In this paper, we show that, given the high dimensional nature of neuroimaging data, it is possible to analytically approximate the null distributions that we ordinarily generate using permutation tests. We verify this approximation by comparing it with actual permutation testing results obtained from several neuroimaging datasets. Some of this work is based on concepts first presented by us in (Gaonkar and Davatzikos, 2012). However, the derivations presented here are more generic. Further, we have added experiments that establish a) the multivariate nature of the inference made using such tests b) advantages compared to typical univariate testing machinery c) advantages compared to inference based on sparse methods.
2. Materials and methods
2.1. Background
2.1.1. Support vector machines
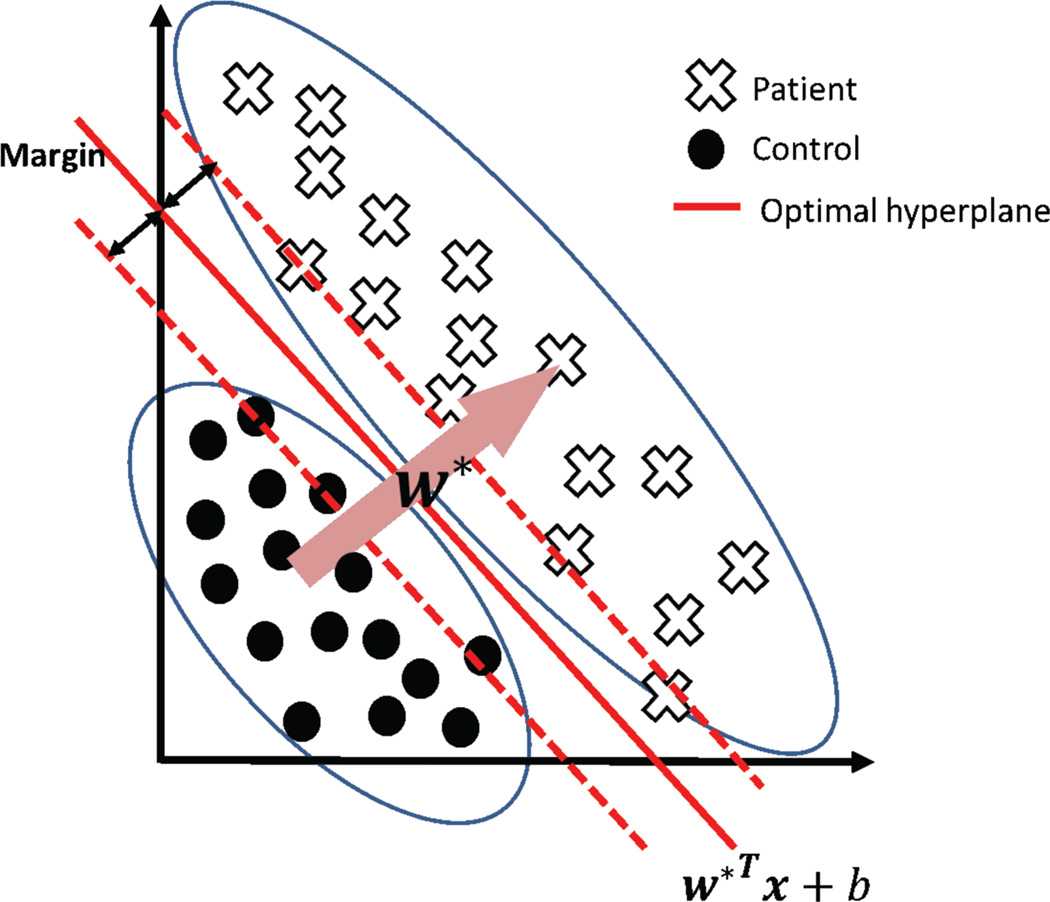
The support vector machine attempts to learn a model from data by finding the largest margin hyperplane that separates data from different conditions (e.g. baseline/activation) or groups (e.g. patients/controls). Training is the process of finding this hyperplane using data with known labels (condition, group, etc.). Now, for data with unknown labels (test data), the SVM uses the hyperplane found (during training) to estimate whether it belongs to a patient or to a control. The SVM treats individual data as points located in a high dimensional space. Figure 1 illustrates the concept of the algorithm in an imaginary 2D space: dots and crosses represent imaging scans taken from two groups or conditions. Even though the two groups cannot be separated on the basis of values along any one dimension the combination of two dimensions gives perfect separation. This corresponds to the situation where a single anatomical region may not provide the necessary discriminative power between groups, whereas the multivariate SVM can still find the relevant hyperplane. Typical imaging data lives in an extremely high dimensional space determined by the number of voxels in each image.
Figure 1.
Illustration of the SVM concept in two dimensions
To apply SVMs in neuroimaging data, we convert an image with D voxels into a vector whose dth component is equal to the intensity value at the dth voxel in the image. Thus, we re-organize the ith image into a D-dimensional point that lives in ℝD. Let us denote the ith point by xi where i ∈ 1, ․…, m indexes all subjects in the study. In most imaging studies, we also have a label associated with each image which tells us whether the image belongs to a patient or a control subject. We denote these labels by y(i) ∈ {+1, −1}. Then the support vector machine finds ’hyperplane coefficients’ denoted by w* and b* such that:
| (1) |
The weight vector w* represents the direction in which the SVM deems the two classes (controls and patients) to differ the most. To determine the label associated with a new test subject xtest we use ytest = sign (w*Txtest + b*). Since the data x(i) are in ℝD; the weight vector w* is also in ℝD. Thus, w* can be represented as an image which we call a ’discriminative map’. However, until now there has been a limited use of SVM based discriminative maps in neuroscience. This is because these maps do not provide a measure of statistical significance associated with a voxel/region of an image. What is the probability that a particular image voxel would have a weight vector component at least as large as the one observed in an experiment due to pure chance alone? To answer such a question, one needs to establish a null distribution on the weight vector components at each image voxel. An empirical approach for obtaining such a null distribution is through the use of permutation tests. We describe permutation testing in the next section.
2.1.2. Permutation tests
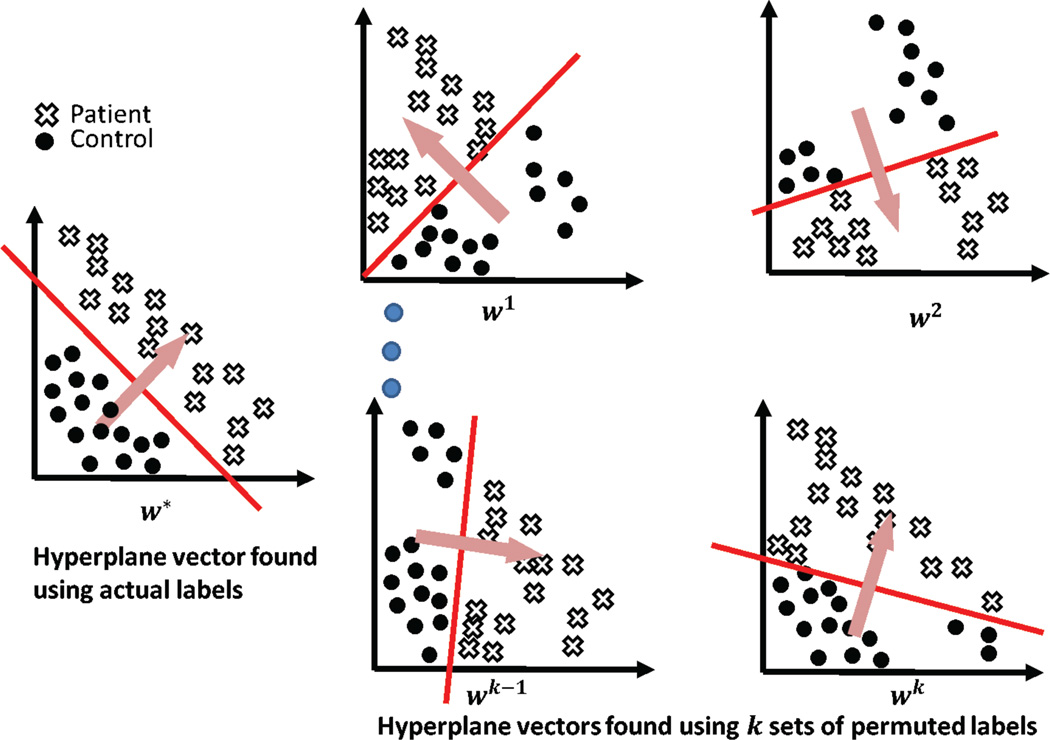
Permutation testing can be used to establish a null distribution on the weight vector components at each image voxel. The permutation testing procedure is illustrated in figure 2. This procedure for permutation testing was applied in the context of neuroimaging by (Mouro-Miranda et al., 2005; Wang et al., 2007). In figure 2, the dots denote controls and the crosses denote patients. The first step involves the generation of a large number of shuffled instances of data labels by random permutations. Each shuffled instance is used to train one SVM. For each instance of shuffled labels, this generates one hyperplane parameterized by the corresponding vector w. Then for any component of w, we have one value corresponding to a specific shuffling of the labels. Collecting the values corresponding to any one component of w allows us to construct a null distribution for that component of w. Recall that each component of ’ w’ corresponds to a voxel location in the original image space. Thus, we now have a null distribution associated with every voxel in the image space. Comparing each component of w* with the corresponding null distribution allows us to estimate statistical significance.
Figure 2.
Illustration of the permutation testing procedure
While we run tests on each coefficient separately, it is crucial to note that permutation testing based inference is distinct from univariate inference. These tests are capable of identifying multivariate phenomenon that univariate tests cannot find. We further clarify this point using experiments on simulated data presented in the ’Experiments and results’ section.
Further, it is also vital to note that the permutation test based inference method described here is distinct from thresholding SVM weights themselves which has been a popular in literature. However, the thresholding approach is problematic and has also been repeatedly criticized in machine learning literature because a larger weight value does not necessarily indicate higher feature relevance. Limitations of the weight vector component thresholding do not simply carry over to the permutation testing methodology described here. We have included a simulated experiment to establish this fact. In the ’Experiments and results: Comparison with prior art’ section, we show using simulated data that the proposed approach continues to work when SVM weight thresholding fails.
It is obvious that running 1000 permutation tests requires training 1000 support vector machine classifiers. This requires a significant amount of time (a few hours in our case). (In many applications, one might need 10,000 permutations or more). In contrast traditional SPM based methods, (R.S.J. Frackowiak, 1997) can run in a few minutes. Further, some SVM applications involve running separate SVMs on local 3D windows in MR images in order to identify group differences (Xiao et al., 2008; Rao et al., 2011). In such cases, it is computationally infeasible to run the required number of permutation tests experimentally.
2.2. Analytical approximation to permutation tests: the case of balanced data
The primary aim of this work is to show that the permutation testing procedure described above can be replaced by an analytic alternative that can be computed in a small fraction of the time (a few seconds in our case) it takes for performing the actual permutation tests(a few hours for us). We use SVM theory in conjunction with certain observations that seem to apply to high dimensional medical imaging data to derive the approximation. We start by noting that Vapnik Chervonenkis theory (Vapnik, 1995) dictates that linear classifiers shatter high dimension low sample size data. For example, 2 points labeled using any combination of positive and negative labels can always be separated by a line in 2D space. Thus, when the dimensionality is in the millions while the sample sizes are in the hundreds, one can always find ’hyperplanes’ (the high dimensional analogue to lines) that can separate any possible labelling of points. Thus, when using linear SVMs, for any permutation of y one can always find a separating hyperplane that perfectly separates the training data. This allows us to use the hard margin SVM formulation from (Vapnik, 1995) instead of (1) for further analysis in this paper. We write the hard margin SVM (see (Vapnik, 1995)) formulation as:
| (2) |
It is required (see (Bishop, 2007)) that for the ’support vectors’ (indexed by l ∈ {1, 2, ‥, nSV}) we have wTxl + b = yl ∀l. Now, if all our data were support vectors this would allow us to write the constraints in optimization (2) as Xw + Jb = y where J is a column matrix of ones and X is a super long matrix with each row representing one image. For all the medical imaging datasets we investigated most data are support vectors for most permutations(figure 3). Thus, for most permutations we solve the following optimization instead of (2):
| (3) |
Figure 3.
For most permutations the number of support vectors in the learnt model is almost equal to the total number of samples (a) simulated dataset(b) real dataset with Alzheimer’s patients and controls (c) real dataset with liars and truth tellers
The above formulation is truly the heart of the approximation and is exactly the same as an LS-SVM (Suykens and Vandewalle, 1999). This equivalence between the SVM and LS-SVM for high dimensional low sample size data was also previously noted in (Ye and Xiong, 2007) where it was based on observations about the distribution of such data as elucidated in (Hall et al., 2005). This equivalence proves very useful because the LS-SVM, (3) can be solved in the closed form (Suykens and Vandewalle, 1999). Note that all equations from this point on apply as presented to the LS-SVM and are approximately true for most permutations of regular SVMs operating on medical images in high dimensional spaces. We use the method of Lagrange multipliers to solve for w from (3). Next, we write the Lagrangian and solve for w:
| (4) |
Setting and and solving for w yields:
| (5) |
Note that this expresses each component wj of w, where j ∈ ℝD as a linear combination of yi’s. Thus, we can hypothesize about the probability distribution of the components of w, given the distributions of yi. If we let yi attain any of the labels (either +1 or −1) with equal probability, we have a Bernoulli like distribution on yi with E(yi) = 0 and Var(yi) = 1 (we have extended the theory to the case of unequal priors in the next subsection). Since, (5) expresses w as a linear combination of these yi we have:
| (6) |
where Cij are the components of the matrix C, which is defined as:
| (7) |
Further, the variance of each component of w, is controlled by the rows of the matrix C. Thus:
| (8) |
These predicted variances agree well with variance estimates obtained from the actual permutation testing (see results). At this point, we have an analytical method to approximate the mean and the variance of the null distributions of components wj of w (that would otherwise be obtained using permutation testing). We still need to uncover the probability density function (pdf) of wj. Next, we use the Lyapunov central limit theorem to show that when the number of subjects is large, the p.d.f of wj can be approximated by a normal distribution. To this end, from (6) and (7), we have:
| (9) |
where we have defined a new random variable which is linearly dependent on yi. We can infer the expectation and variance of from yi as:
| (10) |
Thus, are independent but not identically distributed and wj are linear combinations of . Then according to the Lyapunov central limit theorem (CLT) wj is distributed normally if:
| (11) |
As is standard practice we check for δ = 1.
| (12) |
Thus, we can write the limit in (11) as:
| (13) |
Hence, given an adequate number of subjects, the Lyanpunov CLT allows us to approximate the distribution of individual components of w using the normal distribution as:
| (14) |
These predicted distributions fit actual distributions obtained using permutation testing (see Section 3). Thus, wj’s computed by an SVM model using true labels can now simply be compared to the distribution given by (14) and statistical inference can be made. Thus, (14) gives us a fast and efficient analytical alternative to actual permutation testing. Next we extend the above theory to cases with unequal priors, the case of the soft margin SVM.
2.3. Analytical approximation of permutation testing: the case of unbalanced data
The above derivation assumes equal priors on labels. This assumption allows us to obtain (6). For such an assumption to hold while performing permutation tests, the study dataset needs to have an equal number of patients and controls. In actual clinical studies, this is seldom the case. When the dataset in unbalanced the prior probabilities, P(yj = +1) and P(yj = −1), are unequal. This requires substantial modification of the above approximation procedure. In this section, we derive the approximate null distributions for permutation testing using unbalanced data in SVMs. Let p denote the fraction of data with label +1. Then we have:
| (15) |
Thus, the expected value and variance of the labels during permutations can be written as:
| (16) |
Then, we compute the expectation and variance of the components of w using (10) as:
| (17) |
Rewriting equation (12) for δ = 1 gives us:
| (18) |
where μk = 2p − 1. The limit in (13) can be written as:
| (19) |
which tends to zero on its own.
Now each limit in the round brackets tends to zero as the denominator m → ∞ and the Lyapunov CLT continues to apply. Thus, in the case of unbalanced data we still have a normal distribution on the components of w. This distribution is given by:
| (21) |
We verify this approximation in the experiments section using real data from ADNI.
2.4. The case of the soft margin SVM
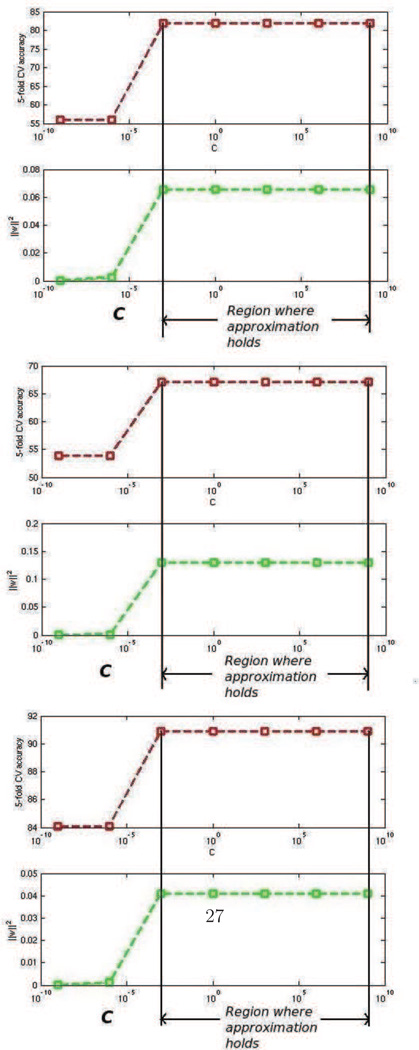
The above permutation testing approximation procedure applies directly to hard margin SVMs. Suppose we were to use soft margin classification instead, how would it change the approximation? First recall that typically for large values of the parameter ’C’ in (2), the SVM penalizes errors in classification heavily. Hence, the slack ξi = 0∀i. When this happens the solution to the soft margin and hard margin cases are the same. When perfect separability exists (such as the case of high dimensional low sample size data) the advantage of setting ξi ≠ 0 can be realized only at extremely small values of ’C’ where the optimizer typically forces ‖w‖2, the first term in (2) to go to zero. When this happens the approximation described above will break down. However, 1) This happens for an extremely small range of values of C 2) the generalization performance of the classifier as measured by cross validation is also poor in when ’C’ is extremely small (see figure 4) 3) when C is not extremely small and, the data are high dimensional with low sample size ξi = 0∀i and the solution w remains the same for all values of C. Authors of (Rasmussen et al., 2012) have previously noted this for neuroimaging data. We found this to be true in experiments, as well, (see figure 4). Since, neuroimaging analysis usually concerns itself with values of C where the accuracy is the highest, we do not concern ourselves with regions where the approximation breaks down.
Figure 4.
3. Experiments and results: Qualitative analysis
We performed 3 experiments in order to gain insight into the proposed analytic approximation of permutation testing. In all experiments, we compared the analytically predicted null distributions with the ones obtained from actual permutation testing. We have presented these comparisons for three different magnetic resonance imaging (MRI) datasets. We perform experiments using one simulated and two real datasets. The first of the real datasets is structural MRI data pertaining to Alzheimer’s disease. The second of the real datasets is a functional MRI dataset pertaining to lie detection. We use LIBSVM (Chang and Lin, 2011) for all experiments described here. Next, we provide a detailed description of the data and the experiments.
3.1. Simulated data
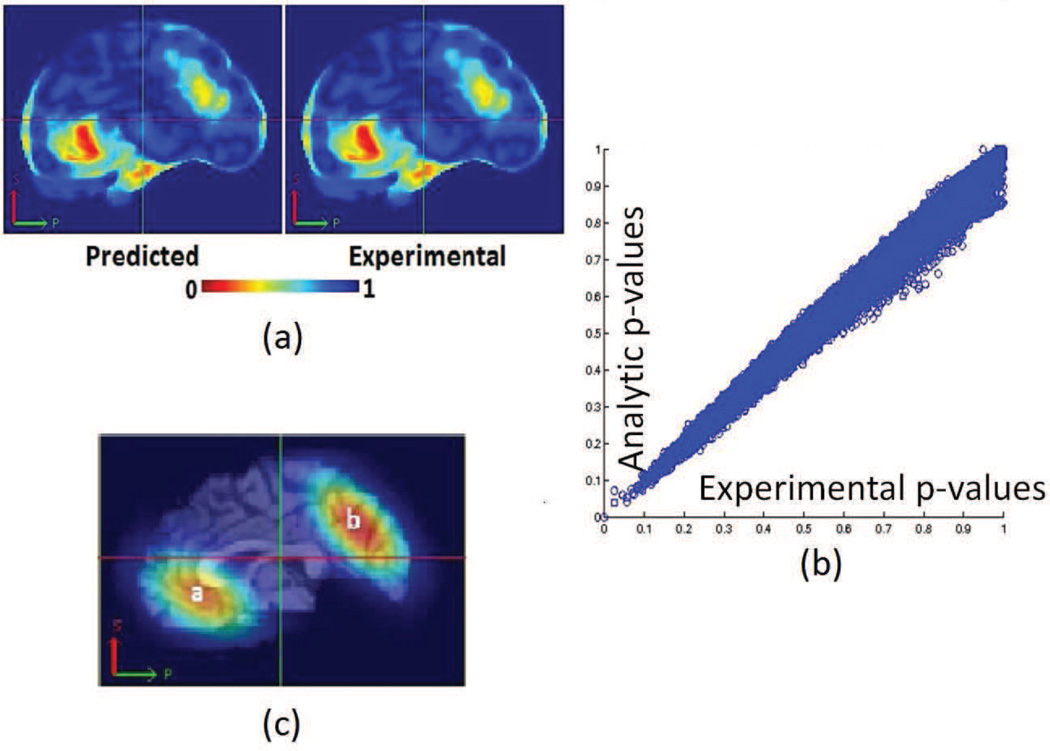
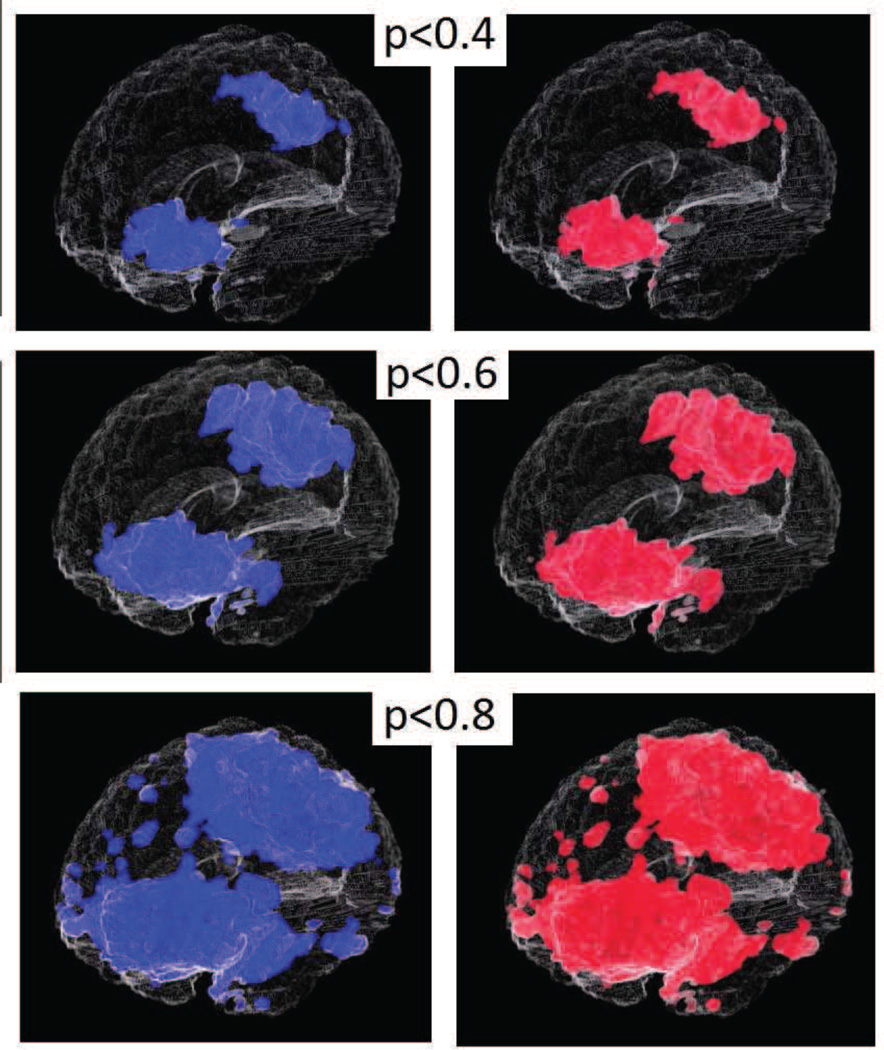
We obtained grey matter tissue density maps (GM-TDMs) of 152 normal subjects from the authors of (Davatzikos et al., 2011). The authors of (Davatzikos et al., 2011) generated these GM-TDMs using the RAVENS (Davatzikos et al., 2001) approach. We divided the TDMs into two equal groups. In one of the two groups, (simulated patients) we reduced the intensity values of GM-TDMs over two large regions of the brain. We did this to simulate the effect of grey matter atrophy. We constructed these artificial regions of atrophy using 3D Gaussians. The maximal atrophy introduced at the center of each Gaussian was 33%. The reduction in the regions surrounding the center of this Gaussian was much lesser than 33%. We show the regions where we introduced artificial atrophy in figure 5c. We trained an SVM model to separate simulated patients from controls. We also performed permutation tests to obtain empirical approximations to null distributions of the wj. We compared the components of the trained SVM models to the associated empirical null distributions for obtaining ’empirical p-maps’. A similar comparison of SVM model components with theoretically predicted null distributions yielded ’analytic p-maps’. Figure 5 presents a 2D section of these p-maps as well as a scatter plot (using the full 3D image) of p-values obtained experimentally vs those obtained analytically. Figure 6 presents a visual comparison of the p-maps in 3D by thresholding p-maps at several arbitrarily chosen thresholds. Figure 6 shows that analytically obtained p-maps are visually indistinguishable from experimentally obtained ones.
Figure 5.
Results of experiments with simulated data (a)A sagittal section through p-maps obtained from experimental and analytical permutation tests (b) A scatter plot of p-values from experimental and analytical p-value maps (c) Regions where simulated atrophy was introduced
Figure 6.
Simulated data: Experimental and analytical p-value maps thresholded at arbitrary p-values (3D)
3.2. Alzheimer’s Disease data
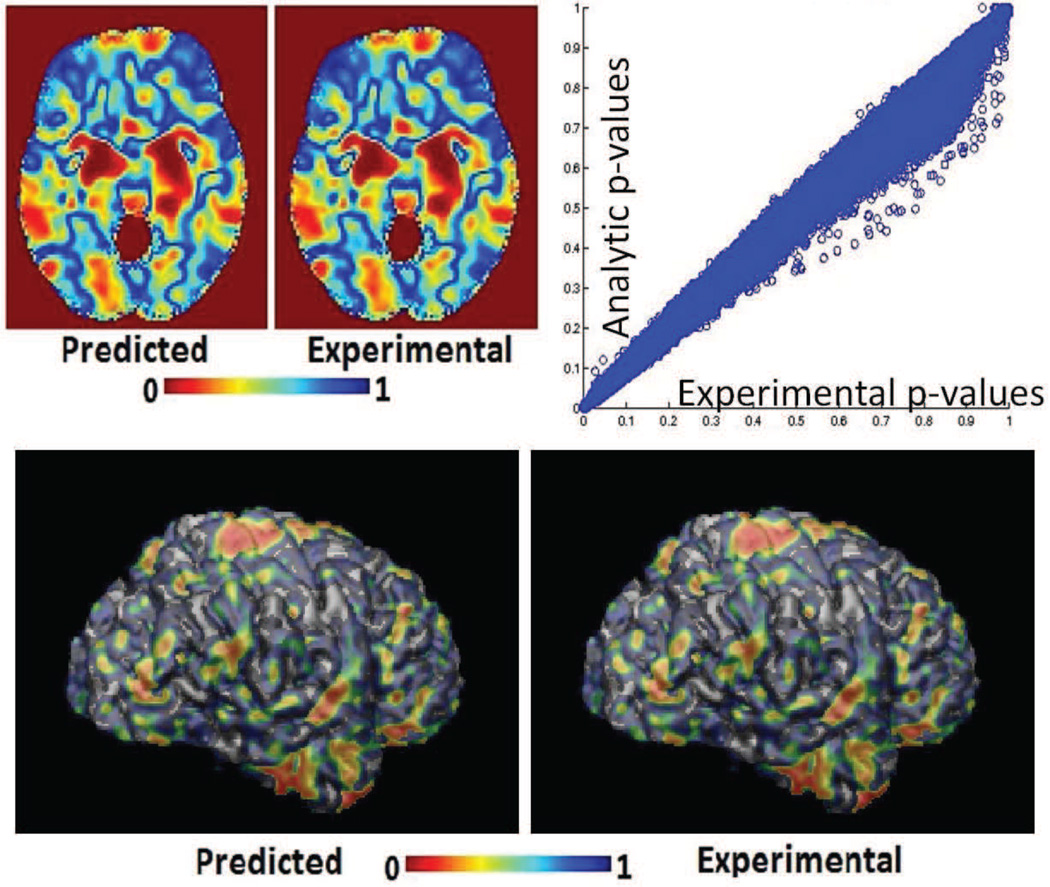
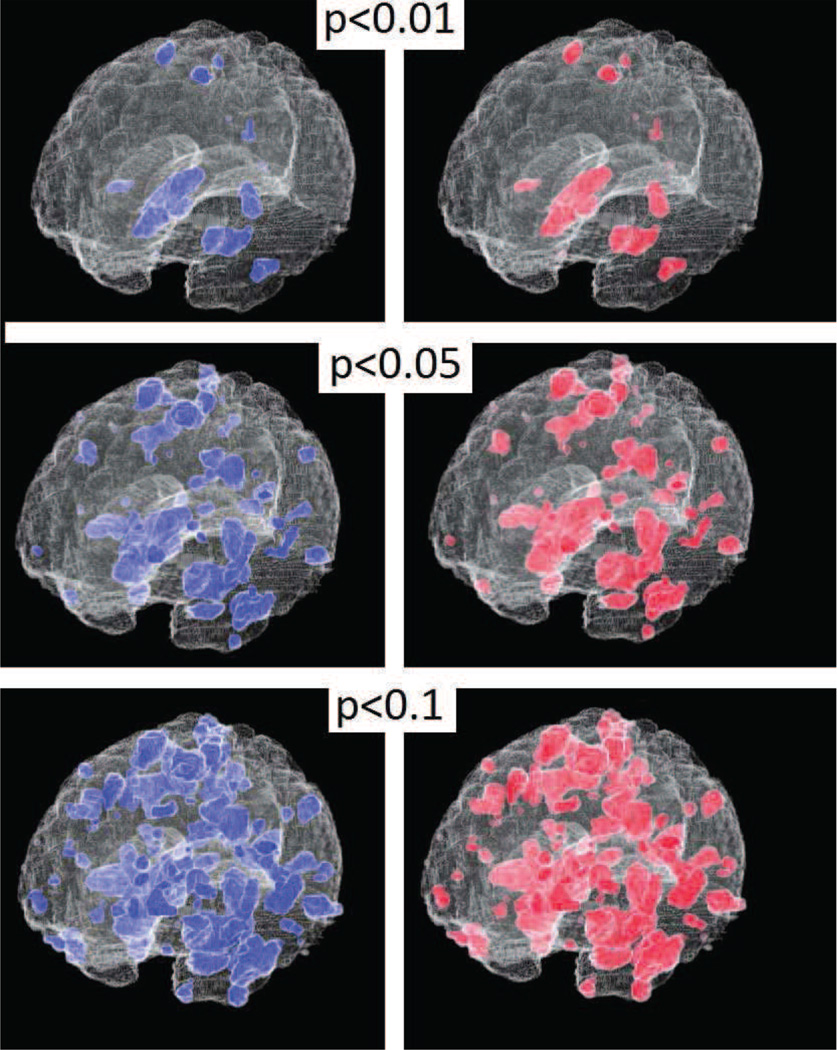
We present experimental results using data from the Alzheimer’s disease neuroimaging initiative study. The authors of (Davatzikos et al., 2011) preprocessed raw T1-structural MR images using a pipeline that involved skull stripping using BET (Smith, 2002), followed by bias correction using N3 (Sled et al., 1998) and segmentation into grey matter (GM), white matter (WM) and ventricular (VN) CSF using fuzzy c-means clustering (Pham and Prince, 1999). They then generated tissue density maps for each tissue type (GM,WM,VN) using the RAVENS(Davatzikos et al., 2001) approach. For the experiment detailed next we obtained these RAVENS maps directly from the authors of (Davatzikos et al., 2011). A total of 278 GM, WM and ventricular tissue density maps were available for our experiment. The processed dataset contained images corresponding to 152 controls and 126 Alzheimer’s patients. All three tissue density maps of a particular subject were concatenated into a long vector xi for analysis. Actual permutation tests were then performed to experimentally generate the null distributions described in Section 2. The analytic null distributions were predicted using equation (21). We then trained an SVM model using the original labels and compared its’ components to the pre-computed experimental and analytic null distribution to obtain analytic and experimental p-value maps. Figure 7 presents a 2D axial section of these p-maps as well as a scatter plot(using the full 3D image) of p-values obtained experimentally vs those obtained analytically. Figure 8 presents a visual comparison of the p-maps in 3D by thresholding p-maps at several arbitrarily chosen thresholds. Figure 8 shows that the analytic and experimental p-maps are visually indistinguishable.
Figure 7.
Results of experiments with simulated data (a)An axial section through p-maps obtained from experimental and analytical permutation tests (b) A scatter plot of p-values experimental and analytical p-value maps
Figure 8.
Alzheimers disease: Experimental and analytical p-value maps thresholded at arbitrary p-values (3D)
3.3. Lie detection data(fMRI)
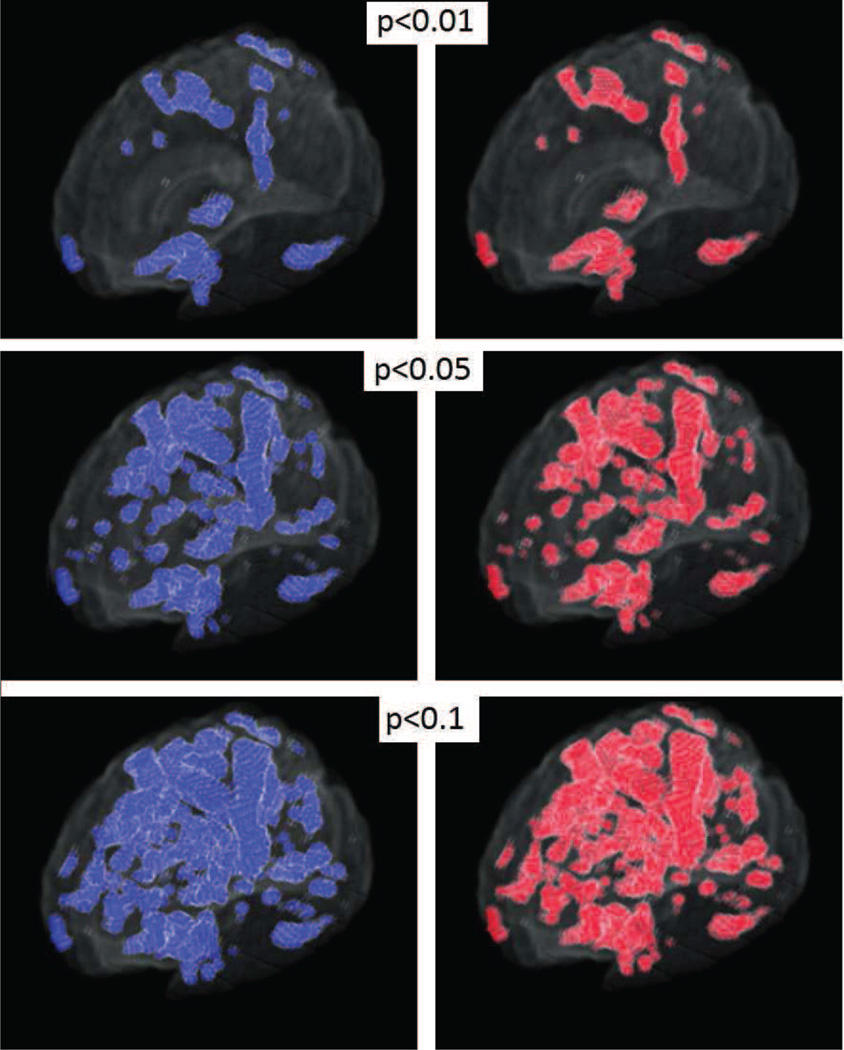
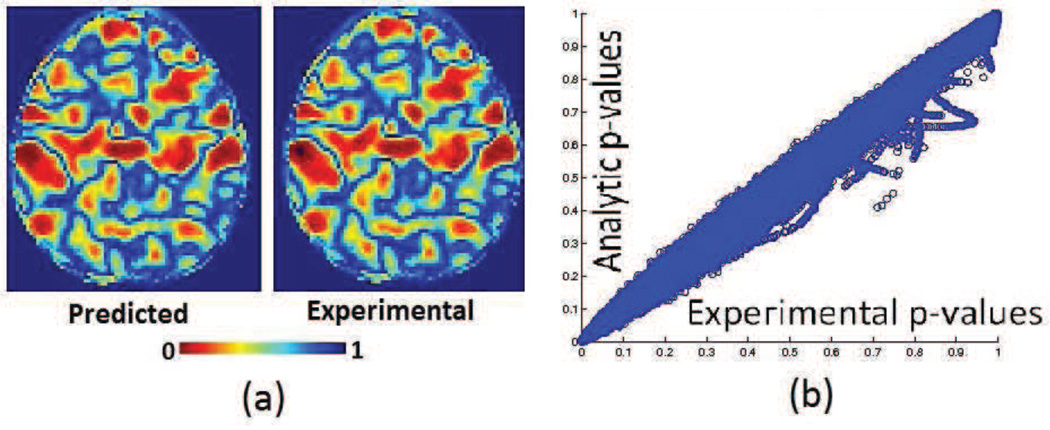
Functional data were preprocessed to obtain parameter Estimate Images (PEIs) as described in (Davatzikos et al., 2005). A total of 44 PEIs, half of which consisted of lying responses and half of which consisted of truth-telling responses were used for the analysis. These data were obtained directly from the authors of (Davatzikos et al., 2005). Null distributions were obtained using analytic and experimental permutation testing as before. An SVM was trained using the actual labels as well. A section through the analytic and experimental p-maps is presented in 9. The scatter plot of analytic vs experimental p-values generated using the entire 3D volume is also shown in 9. This plot shows that the approximation is less accurate here as compared to the simulated data or the Alzheimer’s disease data. This is possibly due to the relatively smaller sample size. However, despite the relatively small sample size of 44 in this experiment it is still visually difficult to tell the difference between theoretically predicted and experimentally obtained p-maps (figure 10).
Figure 10.
fMRI lie detection data: Experimental and analytical p-value maps thresholded at arbitrary p-values (3D)
3.4. A note on classifier accuracies
The classifiers trained above are linear classifiers trained on high dimension low sample size data. On the training set such classifiers are bound to be a 100% accurate. The generalization accuracy of these classifiers can be estimated using leave one out cross validation accuracy (LOOCV) (Vapnik, 1995)(Burges, 1998)(Bishop, 2007). The LOOCV accuracy of the linear SVM classifier for the simulated dataset described in section 4.1 was 100%. For the Alzheimer’s disease dataset LOOCV accuracy was 86% and for the lie detection dataset it was 84%.
4. Experiments and results: Quantitative analysis
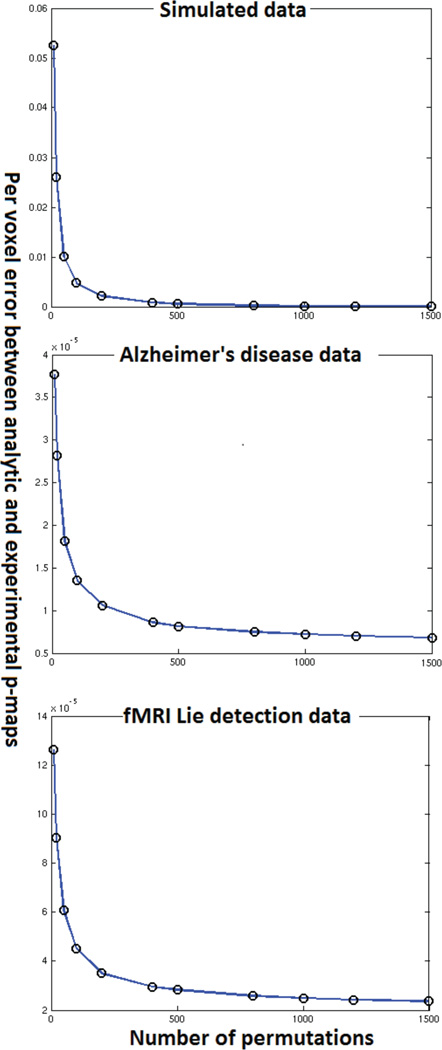
An important question that is left unanswered by the qualitative analysis is that of how the performance of the approximation deteriorates. Specifically the effect of sample size and dimensionality on the approximation is not outlined by the experiments described above. Another interesting aspect is the study of how the number of permutations done in the experimental permutation tests affect the convergence of the approximation. In this section we present experiments to gain some insight into these questions. These experiments required the performance of empirical permutation tests with images of different dimensionality and datasets of different sizes all of which had to be generated stored and loaded from memory on a large parallel cluster. As such an enormous amount of computational time and has gone into producing figures 14–16.
Figure 14.
Approximation accuracy and number of permutations
Figure 16.
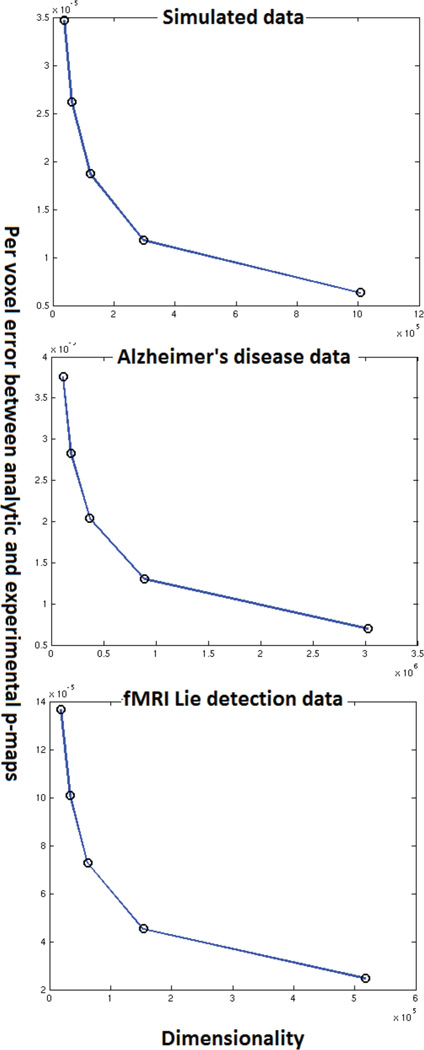
Approximation accuracy and dimensionality
For all experiments presented here we have computed p-maps using the analytic approximation as well as empirical permutation testing. We use the average per voxel error between the two p-maps as a measure of deviation of the approximate from the empirical permutation testing result. Note that such a normalized measure of difference between images is especially useful while studying the effect of dimensionality on the convergence of the approximation. All three datasets described in the previous section have been used for experiments performed in this section. In case of the Alzheimer’s disease dataset we randomly chose a 100 patients and a 100 subjects instead of using the entire data. This was done because it made it simpler to set up the experiment studying the effect of sample size. We describe each set of experiments in more detail next.
4.1. Effect of number of permutations
We ran empirical permutation tests with 1500 permutations using all three datasets. We stored the models corresponding to each permutation to disk. To obtain the approximation accuracy for (randomly picked) one thousand permutations all we had to do was load results of 1000 of the stored models, compute the empirical p-map and compare it with its analytic counterpart. We used this approach to generate figure 14. Figure 14 shows the average per voxel error in p-values obtained using actual permutation tests and the analytical approximation for all three datasets. Figure 14 indicates that the error reduces exponentially as the number of permutations increase. We need to perform experiments with an even larger number of permutations to confirm this trend. However, such experiments require a substantial amount of computational power and storage space. We plan to perform these experiments as a part of future work.
4.2. Effect of reducing dimensionality
In this section, we address the impact of data dimensionality on the accuracy of the proposed approximation. To generate data of varying dimensionality we subsampled the imaging data at several different subsampling rates. Each subsampling rate yielded a new dataset whose dimensionality was much smaller than the original data. Then we ran empirical permutation tests (1000 random permutations) with SVMs on this subsampled data. We also computed the analytical approximation for each of the subsampled datasets. We plot the per voxel error rate between the analytic approximation and experimental permutation testing in figure 15. It can be seen that reduced dimensionality leads to a higher error rate. This indicates that the approximation works better when the data dimensionality is higher. We expected this intuitively, given that the approximation of an SVM by an LS-SVM is better when the dimensionality is higher. The experimental result simply confirms this intuition. From figure 15 one may speculate that increased dimensionality leads to an exponential decay in the approximation error. However, this needs to be confirmed by future theoretical analysis.
Figure 15.
Approximation accuracy and dimensionality
4.3. Effect of reducing sample size
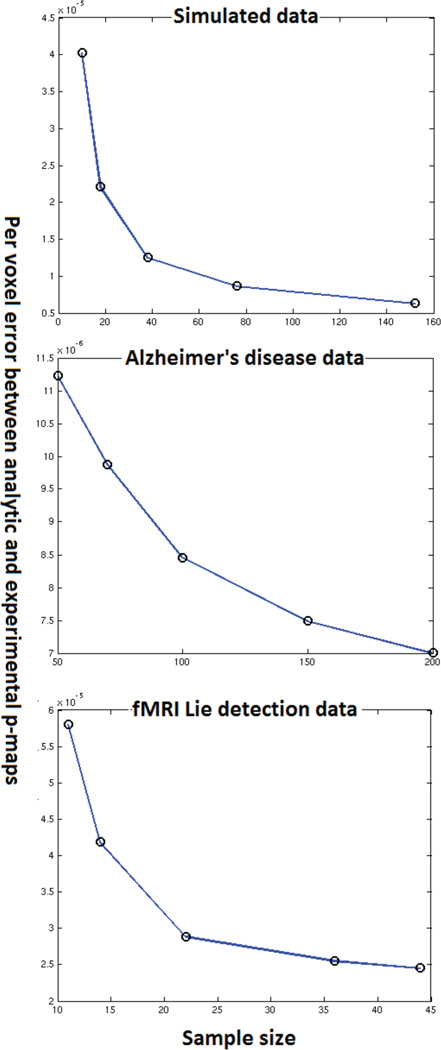
We have based the proposed analytic approximation on the central limit theorem. Hence we expect that an increased sample size would improve approximation accuracy. To understand the effect of sample size we consecutively halve the sample size and re-run both, the empirical permutation tests (1000 random permutations) and the analytic approximations. For instance, if we had 100 patients and 100 controls, we ran experiments with the whole dataset, a dataset with 50 patients and 50 controls, 25 patients and 25 controls. In case of the Alzheimer’s and fMRI datasets we added an extra point (75% of the full sample size) to better map the effect of sample size in this range. Figure 16 shows the variation of approximation accuracy with sample size for all three datasets that we ran experiments on. As expected, a larger sample size leads to higher accuracy. Note that even for sample sizes close to 20 the error in p-values is small (order of 10−5) for the fMRI data. In the Alzheimer’s disease data where the dimensionality was substantially higher, the error is always in the order of 10−6. Just like dimensionality, increased sample size also seems to produce an exponential reduction in the error of approximation. However we will need further theoretical work to confirm this.
5. Experiments and results: Comparison with prior art
The experiments presented above study the validity of the approximation in relation to actual permutation testing. We present some simple experiments in this section that show that permutation testing using SVMs weight vector coefficients can indeed detect multivariate patterns and that using permutation tests is better than using SVM weights directly. We also contrast the permutation testing based approach with some of the other popular multivariate approaches based on sparsity.
5.1. Experiment comparing univariate analysis and permutation testing analysis
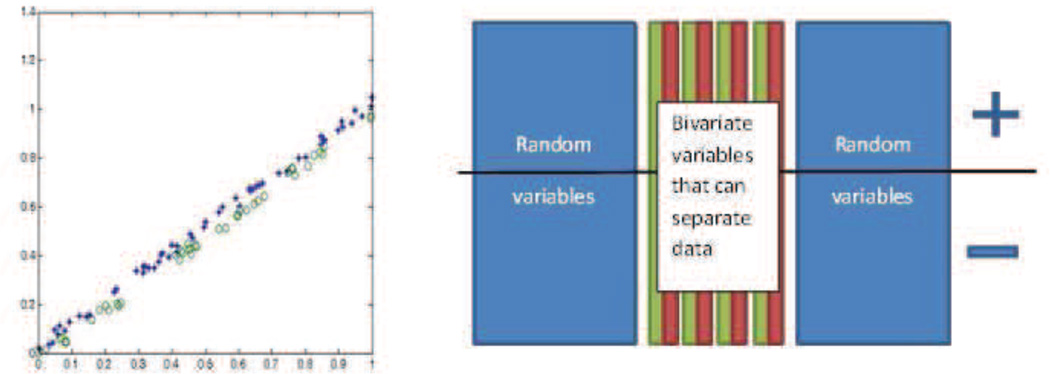
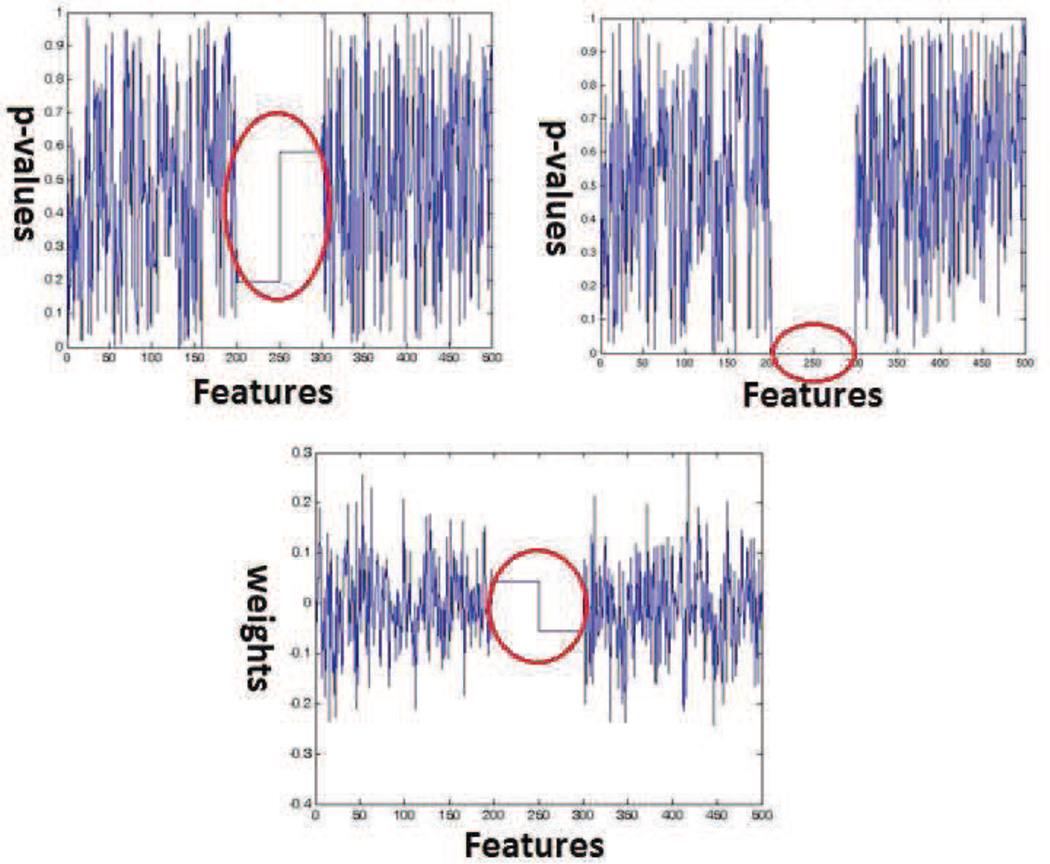
An important aspect of SVM weight based permutation testing is that it can detect multivariate patterns that univariate analysis will miss. This is despite the fact that we are performing hypothesis testing on individual hyperplane coefficients. We demonstrate this behavior with a simple experiment on simulated data. To simulate a multivariate effect we constructed labels and data that could only be separated using two variables combined. Thus, we simulated a bivariate pattern. Figure 11 (left) shows the simulated bivariate effect. These bivariate variables which are represented by the red and green columns of Figure 11 are repeated column wise over and over again to simulate a differential effect between positively and negatively labeled samples. Using this process we generated a hundred relevant features. Further, we added 400 noise variables that had no relation with the labels to obtain the final dataset. Figure 11 (right) illustrates the scheme of simulation. The matlab code used to generate the simulated data is available online as a part of the supplementary materials. See section 8 for details. Figure 12 (top-left) shows p-values obtained by running feature by feature univariate t-tests. Figure 12 (top-right) shows p-values obtained using SVM weight based permutation tests. Figure 12 (bottom) shows SVM weights obtained by running a linear SVM using the data and the original labels. The figures show that the p-values generated by univariate tests are in the range of [0.25 0.65] for all simulated bivariate features. The p-values assigned by univariate testing to the remaining noise features also lie in the same range. As opposed to this, p-values generated by permutation testing are in the range [0 0.05] for relevant features. This range is much lower than the p-values the method assigns to the irrelevant features. The weight values associated by the linear SVM with the relevant features are not necessarily higher (or lower) than the weight values associated with irrelevant features. Thus, the proposed permutation testing can detect multivariate patterns that univariate testing (or SVM weight vector thresholding) might miss.
Figure 11.
(Left) Bivariate pattern simulated using two features, (Right) Illustration of simulation procedure
Figure 12.
(Top-Left) p-values generated by univariate t-tests,(Top-Right) p-values generated by SVM based permutation tests. (Bottom)
5.2. Experiment to investigate the multiple comparisons issue in comparison to univariate analysis
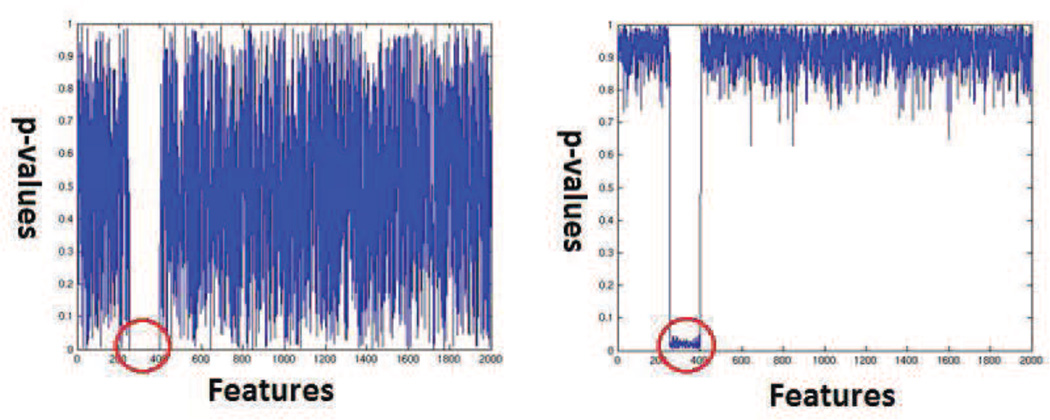
This experiment is designed to show that false positive detection rate for SVM permutation testing is much lower than that of univariate testing. For this experiment, we constructed a simulated dataset as follows. We constructed labels and data that could be separated using only one variable. We repeated the univariate effect variables over and over to obtain sufficient dimensionality. This constitutes a multivariate pattern identifiable using univariate analysis. This pattern of relevant features spanned over 150 features. As before we added a large number of irrelevant noise variables that had no relationship with the labels. The simulated dataset contained a total of 100 feature vectors (50 labeled +1 and 50 labeled −1) of dimensionality 2000. We introduced the simulated univariate effect in 151 features. The matlab code used to generate the simulated data is provided online as a part of the supplementary materials. See section 8 for details. We performed univariate t-tests feature by feature to obtain one p-value per feature. We then plotted these p-values in Figure 13 (left). We also performed SVM permutation tests using the procedure described in the paper and plotted the resulting p-values in Figure 13 (right). Figure 13 shows that univariate, as well as the proposed multivariate analyses, recover the features of interest. However, the univariate analysis machinery has a far higher rate of false positive detection as compared to permutation testing based analysis. The possible reasons for this behavior are further discussed in the discussions section.
Figure 13.
(Left) p-values generated using univariate tests which detect the effect and many false positives (Right) p-values generated using SVM based permutation tests
5.3. Experiment for the comparison of permutation testing with sparsity based multivariate inference methods
A substantial body of literature has been developing around so called sparse methods for multivariate image analysis. For instance, methods described in (Sabuncu and Van Leemput, 2011; Batmanghelich et al., 2012; Ryali et al., 2010; Gaonkar et al., 2011) attempt to apply sparsity to make interpretations/inferences. This is a growing body of literature and comparing permutation testing with every possible method out there is beyond the scope of this paper. A large fraction of sparse methods use L-1 norm minimization. Hence we compared the proposed method with two methods that we believed to be representative of this literature, namely the LASSO and the elastic net. The data simulation used was the same as for section 5.2. The matlab code for generating this data is available in the supplementary materials. See section 8 for more details. We ran LASSO for variable selection repeatedly with decreasing parameter values until the procedure started picking up false positives (started behaving like ordinary unregularized regression). We also ran elastic nets with several parameter settings, recorded the results and compared with the SVM permutations based method. We tabulated results for the LASSO in table 9 and the results for the elastic net in table 9. From the tables, we can see that the LASSO can never find more features than the number of samples. This is a known limitation of the LASSO and one of the primary reasons for using Elastic nets. Selection of the minimum number of features using cross validation will yield an answer of 1. This alone is reason enough to avoid using the LASSO in neuroimaging analysis. We wish to find regions associated with diseased pathology and not eliminate them. The SVM based permutation approach does not suffer from this limitation of the LASSO. The elastic net remedies the limitation of the LASSO and can find all the features introduced for certain parameter values. However, it still suffers from the parameter selection problem. In the simulated case, where relevant features are highly correlated cross validation based parameter selection would give the same accuracies whether we select one relevant feature or 151 relevant features. In such a case cross validation based parameter selection fails, as well. Again SVM based permutation tests do not suffer from these limitations.
6. Discussion
In this section we first provide a brief synopsis of the paper followed by a discussion of some of the advantages of the permutation testing approach as compared to classical methods. Then we discuss some implications of the approximation on multiple comparisons testing. Finally, we end the section with a discussion of possible future work.
6.1. Synopsis
We have described a fast and efficient way to approximate the results of computationally intensive permutation testing. We can apply this technique to perform permutation testing quickly in order to interpret SVM models and to derive image wide statistical significance maps. While people have used SVM classifiers for distinguishing between patients and controls on the basis of medical image data, it has been difficult to interpret the SVM model, which the classifier uses to drive its decisions. Interpreting these SVM models is essential in order to understand which regions/features contribute statistically significantly to the classifier decision. Previously, obtaining such interpretations required hours or days of computation to perform permutation tests. This work describes an analytical short-cut that cuts this time down to a few seconds of computation. Thus, statistical inference for SVM based multivariate image analysis is now possible in a time frame comparable to that of univariate methods such as voxel based morphometry. This is significant because multivariate analysis offers several advantages over univariate analysis (Davatzikos, 2004). The most notable advantage of multivariate image analysis is that there is the possibility of identifying networks of non proximal brain regions (multivariate patterns) that produce pathology. This fact is not generally be true of univariate type of analysis (Davatzikos, 2004). Such network analysis is highly relevant while exploring neuroimaging data due to the high degree of interconnectivity of several brain regions. As such, SVM based image classification has become routine in neuroimaging and this paper aims to make it equally easy to perform multivariate morphometric analysis using SVMs.
6.2. The multiple comparisons problem needs to be handled differently for SVM based permutation tests
Classical methods used for correcting for multiple comparisons used in neuroimaging include the Bonferroni correction, false discovery rate and cluster size inference. These paradigms were designed with multiple independent univariate tests in mind. For instance in the experiment used to generate figure 13 the univariate t-tests are independent of each other. In contrast to this, in SVM based permutation testing uses individual weight vector coefficients that depend on each other. Thus, the multiple comparisons issue has to be addressed differently for SVM based permutation testing because the coefficients wj are not independent of each other. In fact, these coefficients are linearly dependent on each other as long as the approximation holds. To see this, note that (as long as subjects are linearly independent of each other):
| (22) |
Thus, there must exist atleast m ’independent’ rows in the matrix C. Let Cind ∈ ℝm×m be a matrix formed using these independent rows. Also, let wind ∈ ℝm contain the weight vector coefficients corresponding to the rows chosen from C to generate Cind. Then for any permutation we have:
| (23) |
Since such a Cind would be full rank and square. Hence one could invert it to have:
| (24) |
Now using (7) and (5) we can say:
| (25) |
C does not change from one permutation to the next. Neither do the locations of wind in w. This maintains linear dependence between coefficients across models trained using different sets of permuted labels. Thus, at most m components of the vector w can be considered to be independent of each other. Further, equation (5) uses information from the entire set of images to derive every coefficient w. Thus, as noted before a statistical test performed on a specific coefficient considers multivariate information, and is not a univariate test. This dependence structure makes the application of traditional correction methods to p-values obtained from SVM permutation testing excessively conservative. This dependency might be a possible explanation for figure 13. It is important to note that the above mentioned theory does not solve the multiple comparisons issue. It merely hints at the fact that multiple comparisons for SVM based permutation testing might need to be dealt with in a manner different from standard univariate multiple control procedures.
6.3. Extensions to other multivariate methods
Future work also needs to address the possibility of such approximations in case of other linear as well as nonlinear classifiers. Often, in case of SVMs nonlinear kernel definitions can be interpreted as solving (1) after projecting the data from the original low dimensional to a kernel specific high dimensional space. If the theory, developed above holds in the kernel specific high dimensional space then it should be possible to develop a theoretical approximation to permutation testing using nonlinear SVMs.
We have not addressed this potential extension here, but it will be part of future work.
Clinically, SVM based regression is gaining importance. SVM regression can be used to predict clinical scores and variables like age directly from brain images. It is crucial to note that the above approximation to permutation testing strictly applies only in the case of SVM classification. An extension to SVM regression if possible is non trivial and is a definite topic of future development.
Another avenue of future work lies in expanding this work to dictionary learning analysis. SVM analysis is not well suited for exploring data heterogeneity. For instance, suppose we had a hypothesis that two separate brain networks that are acting together to produce an effect. Permutation testing with SVMs can only detect a single network. Dictionary learning methods like independent components analysis (ICA) can reveal the existence of these disparate networks. FMRI analysis routinely uses these methods. However, just as in SVMs, apart from permutation tests there exists no way to interpret the results of dictionary learning. Hence, it would be useful to develop and apply some variant of the above technique in this context, as well.
7. Conclusion
In conclusion, we have shown in this article that there exists an analytical approximation to permutation testing using SVMs if we are using high dimensional medical imaging data. Further, the analytical computation can be completed in a small fraction of the time it would take in order to perform a permutation test. This approximation can thus save a tremendous amount of time and allow for a faster interpretation of SVM models in medical imaging.
Supplementary Material
Figure 9.
Results of experiments with fMRI lie detection data (a)An axial section through p-maps obtained from experimental and analytical permutation tests (b) A scatter plot of p-values experimental and analytical p-value maps
Table 1.
Comparison between LASSO and SVM permutation test based approach
| LASSO | SVM permutations | Truth | |||
|---|---|---|---|---|---|
| Lambda | Number of true positives |
Number of false positives |
True positives at p ≤0.05 |
False positives at p ≤0.05 |
|
| 1 | 0 | 0 | 151 | 0 | 151 |
| 0.9 | 2 | 0 | 151 | 0 | 151 |
| 0.5 | 17 | 0 | 151 | 0 | 151 |
| 0.05 | 69 | 0 | 151 | 0 | 151 |
| 0.004 | 99 | 0 | 151 | 0 | 151 |
| 0.002 | 95 | 9 | 151 | 0 | 151 |
Table 2.
Comparison between elastic nets and SVM based permutation tests
| Elastic net | SVM permutations |
Truth | ||||
|---|---|---|---|---|---|---|
| Lambda | Alpha | Number of true positives |
Number of false positives |
True positives at p ≤ 0.05 |
False positives at p ≤ 0.05 |
|
| 1 | 0.25 | 138 | 0 | 151 | 0 | 151 |
| 1 | 0.75 | 15 | 0 | 151 | 0 | 151 |
| 0.1 | 0.25 | 138 | 0 | 151 | 0 | 151 |
| 0.1 | 0.75 | 82 | 0 | 151 | 0 | 151 |
| 0.01 | 0.25 | 106 | 7 | 151 | 0 | 151 |
| 0.01 | 0.75 | 90 | 0 | 151 | 0 | 151 |
| 0.001 | 0.25 | 72 | 81 | 151 | 0 | 151 |
| 0.001 | 0.75 | 93 | 53 | 151 | 0 | 151 |
| 1 | 0.05 | 151 | 0 | 151 | 0 | 151 |
Highlights.
Support vector machines (SVM) use multivariate imaging information for diagnosis.
Permutation tests using SVM models can be used for population wide morphometric analysis
Permutation testing is computationally expensive
We approximate permutation testing results using an inexpensive analytic shortcut
We validate and analyze the approximation using experiments with real and simulated data
Footnotes
Publisher's Disclaimer: This is a PDF file of an unedited manuscript that has been accepted for publication. As a service to our customers we are providing this early version of the manuscript. The manuscript will undergo copyediting, typesetting, and review of the resulting proof before it is published in its final citable form. Please note that during the production process errors may be discovered which could affect the content, and all legal disclaimers that apply to the journal pertain.
Supplementary materials and code
In order to enable readers to replicate results presented in this manuscript and perform further experiments of their own we are releasing the code used for the experiments presented here. This code will be downloadable from the authors website at: http://www.rad.upenn.edu/sbia/Bilwaj.Gaonkar/supl_matl_nimg.zip
References
- Ashburner J, Friston KJ. Voxel-based morphometry–the methods. Neuroimage. 2000;11:805–821. doi: 10.1006/nimg.2000.0582. [DOI] [PubMed] [Google Scholar]
- Batmanghelich N, Taskar B, Davatzikos C. Generative-discriminative basis learning for medical imaging. Medical Imaging, IEEE Transactions on. 2012;31:51–69. doi: 10.1109/TMI.2011.2162961. [DOI] [PMC free article] [PubMed] [Google Scholar]
- Bishop CM. Pattern Recognition and Machine Learning (Information Science and Statistics) 1st ed. Springer; 2007. 2006. corr. 2nd printing edition. [Google Scholar]
- Burges CJC. A tutorial on support vector machines for pattern recognition. Data Mining and Knowledge Discovery. 1998;2:121–167. [Google Scholar]
- Chang CC, Lin CJ. LIBSVM: A library for support vector machines. ACM Transactions on Intelligent Systems and Technology 2. 2011;27:1–27. 27. Software available at http://www.csie.ntu.edu.tw/~cjlin/libsvm. [Google Scholar]
- Craddock RC, Holtzheimer PE, 3rd, Hu XP, Mayberg HS. Disease state prediction from resting state functional connectivity. Magn Reson Med. 2009;62:1619–1628. doi: 10.1002/mrm.22159. [DOI] [PMC free article] [PubMed] [Google Scholar]
- Cuingnet R, Rosso C, Chupin M, Lehricy S, Dormont D, Benali H, Samson Y, Colliot O. Spatial regularization of svm for the detection of diffusion alterations associated with stroke outcome. Med Image Anal. 2011;15:729–737. doi: 10.1016/j.media.2011.05.007. [DOI] [PubMed] [Google Scholar]
- Davatzikos C. Why voxel-based morphometric analysis should be used with great caution when characterizing group differences. Neuroimage. 2004;23:17–20. doi: 10.1016/j.neuroimage.2004.05.010. [DOI] [PubMed] [Google Scholar]
- Davatzikos C, Bhatt P, Shaw LM, Batmanghelich KN, Trojanowski JQ. Prediction of mci to ad conversion, via mri csf biomarkers, and pattern classification. Neurobiol Aging 32. 2011:2322.e19–2322.e27. doi: 10.1016/j.neurobiolaging.2010.05.023. [DOI] [PMC free article] [PubMed] [Google Scholar]
- Davatzikos C, Genc A, Xu D, Resnick SM. Voxel-based morphometry using the ravens maps: methods and validation using simulated longitudinal atrophy. Neuroimage. 2001;14:1361–1369. doi: 10.1006/nimg.2001.0937. [DOI] [PubMed] [Google Scholar]
- Davatzikos C, Ruparel K, Fan Y, Shen DG, Acharyya M, Loughead JW, Gur RC, Langleben DD. Classifying spatial patterns of brain activity with machine learning methods: application to lie detection. Neuroimage. 2005;28:663–668. doi: 10.1016/j.neuroimage.2005.08.009. [DOI] [PubMed] [Google Scholar]
- De Martino F, Valente G, Staeren N, Ashburner J, Goebel R, Formisano E. Combining multivariate voxel selection and support vector machines for mapping and classification of fmri spatial patterns. Neuroimage. 2008;43:44–58. doi: 10.1016/j.neuroimage.2008.06.037. [DOI] [PubMed] [Google Scholar]
- Fan Y, Shen D, Gur RC, Gur RE, Davatzikos C. Compare: classification of morphological patterns using adaptive regional elements. IEEE Trans Med Imaging. 2007;26:93–105. doi: 10.1109/TMI.2006.886812. [DOI] [PubMed] [Google Scholar]
- Gaonkar B, Davatzikos C. Proceedings of the 15th international conference on Medical Image Computing and Computer-Assisted Intervention - Volume Part I. Berlin, Heidelberg: Springer-Verlag; 2012. Deriving statistical significance maps for svm based image classification and group comparisons; pp. 723–730. [DOI] [PMC free article] [PubMed] [Google Scholar]
- Gaonkar B, Pohl K, Davatzikos C. Proceedings of the 14th international conference on Medical image computing and computer-assisted intervention - Volume Part II. Berlin, Heidelberg: Springer-Verlag; 2011. Pattern based morphometry; pp. 459–466. [DOI] [PMC free article] [PubMed] [Google Scholar]
- Hall P, Marron JS, Neeman A. Geometric representation of high dimension, low sample size data. Journal of the Royal Statistical Society: Series B (Statistical Methodology) 2005;67:427–444. [Google Scholar]
- Klöppel S, Stonnington CM, Chu C, Draganski B, Scahill RI, Rohrer JD, Fox NC, Jack CR, Jr, Ashburner J, Frackowiak RSJ. Automatic classification of mr scans in alzheimer’s disease. Brain. 2008;131:681–689. doi: 10.1093/brain/awm319. [DOI] [PMC free article] [PubMed] [Google Scholar]
- Koutsouleris N, Meisenzahl EM, Davatzikos C, Bottlender R, Frodl T, Scheuerecker J, Schmitt G, Zetzsche T, Decker P, Reiser M, Mller HJ, Gaser C. Use of neuroanatomical pattern classification to identify subjects in at-risk mental states of psychosis and predict disease transition. Arch Gen Psychiatry. 2009;66:700–712. doi: 10.1001/archgenpsychiatry.2009.62. [DOI] [PMC free article] [PubMed] [Google Scholar]
- Langs G, Menze BH, Lashkari D, Golland P. Detecting stable distributed patterns of brain activation using gini contrast. Neuroimage. 2011;56:497–507. doi: 10.1016/j.neuroimage.2010.07.074. [DOI] [PMC free article] [PubMed] [Google Scholar]
- Mingoia G, Wagner G, Langbein K, Maitra R, Smesny S, Dietzek M, Burmeister HP, Reichenbach JR, Schlsser RGM, Gaser C, Sauer H, Nenadic I. Default mode network activity in schizophrenia studied at resting state using probabilistic ica. Schizophr Res. 2012 doi: 10.1016/j.schres.2012.01.036. [DOI] [PubMed] [Google Scholar]
- Mouro-Miranda J, Bokde ALW, Born C, Hampel H, Stetter M. Classifying brain states and determining the discriminating activation patterns: Support vector machine on functional mri data. Neuroimage. 2005;28:980–995. doi: 10.1016/j.neuroimage.2005.06.070. [DOI] [PubMed] [Google Scholar]
- Pereira F, Gordon G, Faloutsos C, Strother S. Beyond Brain Blobs: Machine Learning Classifiers as Instruments for Analyzing Functional Magnetic Resonance Imaging Data. Technical Report. 1998
- Pham DL, Prince JL. Adaptive fuzzy segmentation of magnetic resonance images. IEEE Trans Med Imaging. 1999;18:737–752. doi: 10.1109/42.802752. [DOI] [PubMed] [Google Scholar]
- Rao A, Garg R, Cecchi G. A spatio-temporal support vector machine searchlight for fmri analysis; Biomedical Imaging: From Nano to Macro 2011 IEEE International Symposium on; 2011. pp. 1023–1026. [Google Scholar]
- Rasmussen PM, Hansen LK, Madsen KH, Churchill NW, Strother SC. Model sparsity and brain pattern interpretation of classification models in neuroimaging. Pattern Recognition. 2012;45:2085–2100. [Google Scholar]
- Richiardi J, Eryilmaz H, Schwartz S, Vuilleumier P, Van De Ville D. Decoding brain states from fmri connectivity graphs. Neuroimage. 2011;56:616–626. doi: 10.1016/j.neuroimage.2010.05.081. [DOI] [PubMed] [Google Scholar]
- Frackowiak RSJ, Friston KJ, CFRD . Human Brain Function. USA: Academic Press; 1997. [Google Scholar]
- Ryali S, Supekar K, Abrams DA, Menon V. Sparse logistic regression for whole-brain classification of fmri data. NeuroImage. 2010;51:752–764. doi: 10.1016/j.neuroimage.2010.02.040. [DOI] [PMC free article] [PubMed] [Google Scholar]
- Sabuncu MR, Van Leemput K. The relevance voxel machine (rvoxm): a bayesian method for image-based prediction. Med Image Comput Comput Assist Interv. 2011;14:99–106. doi: 10.1007/978-3-642-23626-6_13. [DOI] [PMC free article] [PubMed] [Google Scholar]
- Sled JG, Zijdenbos AP, Evans AC. A nonparametric method for automatic correction of intensity nonuniformity in mri data. IEEE Trans Med Imaging. 1998;17:87–97. doi: 10.1109/42.668698. [DOI] [PubMed] [Google Scholar]
- Smith SM. Fast robust automated brain extraction. Hum Brain Mapp. 2002;17:143–155. doi: 10.1002/hbm.10062. [DOI] [PMC free article] [PubMed] [Google Scholar]
- Suykens JAK, Vandewalle J. Least Squares Support Vector Machine Classifiers. Neural Processing Letters. 1999;9:293–300. [Google Scholar]
- Vapnik VN. The nature of statistical learning theory. New York, NY, USA: Springer-Verlag New York, Inc.; 1995. [Google Scholar]
- Vemuri P, Gunter JL, Senjem ML, Whitwell JL, Kantarci K, Knopman DS, Boeve BF, Petersen RC, Jack CR., Jr Alzheimer’s disease diagnosis in individual subjects using structural mr images: validation studies. Neuroimage. 2008;39:1186–1197. doi: 10.1016/j.neuroimage.2007.09.073. [DOI] [PMC free article] [PubMed] [Google Scholar]
- Venkataraman A, Rathi Y, Kubicki M, Westin CF, Golland P. Joint modeling of anatomical and functional connectivity for population studies. IEEE Trans Med Imaging. 2012;31:164–182. doi: 10.1109/TMI.2011.2166083. [DOI] [PMC free article] [PubMed] [Google Scholar]
- Wang Z, Childress AR, Wang J, Detre JA. Support vector machine learning-based fmri data group analysis. Neuroimage. 2007;36:1139–1151. doi: 10.1016/j.neuroimage.2007.03.072. [DOI] [PMC free article] [PubMed] [Google Scholar]
- Xiao Y, Rao R, Cecchi G, Kaplan E. Improved mapping of information distribution across the cortical surface with the support vector machine. Neural Netw. 2008;21:341–348. doi: 10.1016/j.neunet.2007.12.022. [DOI] [PMC free article] [PubMed] [Google Scholar]
- Xu L, Groth KM, Pearlson G, Schretlen DJ, Calhoun VD. Source-based morphometry: the use of independent component analysis to identify gray matter differences with application to schizophrenia. Hum Brain Mapp. 2009;30:711–724. doi: 10.1002/hbm.20540. [DOI] [PMC free article] [PubMed] [Google Scholar]
- Ye J, Xiong T. Svm versus least squares svm. Journal of Machine Learning Research - Proceedings Track. 2007:644–651. [Google Scholar]
Associated Data
This section collects any data citations, data availability statements, or supplementary materials included in this article.


