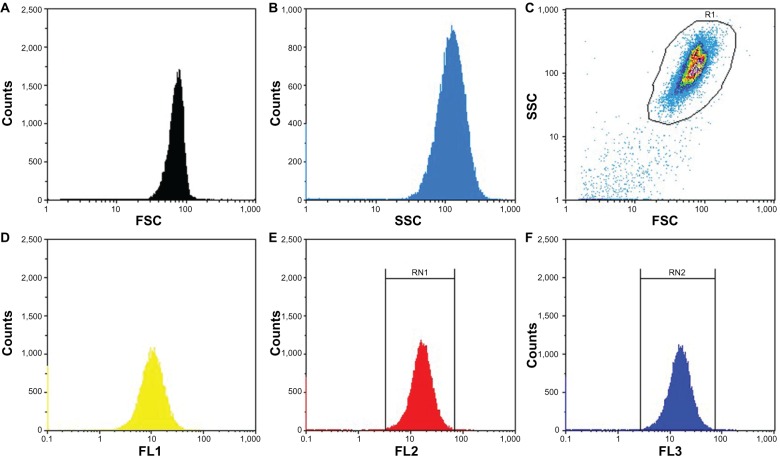
Figure 2.
Flow cytometric analysis of SPION microbubbles. FSC shows size distribution (A and C) and SSC provides information about the surface (B and C), indicating a narrow size distribution and homogeneous surface. The different fluorescent lasers [FL1 (D) 536 ± 40 nm; FL2 (E) 590 ± 50 nm; FL3 (F) 675 nm] show that the dye is homogenously distributed among the SPION microbubbles.
Abbreviations: FSC, forward scattering; SSC, sideward scattering; SPION, superparamagnetic iron oxide.

