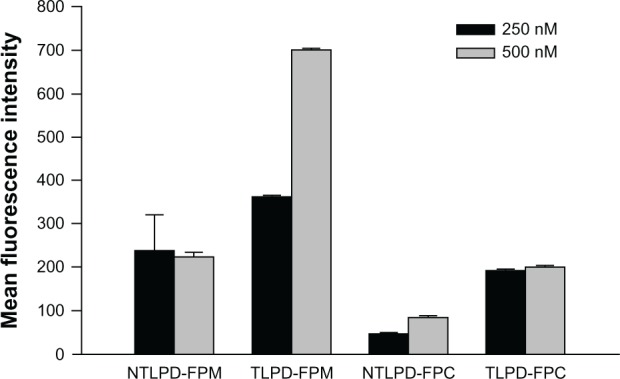
Figure 8.

Cellular uptake of SMMC-7721 cells in vitro. After treatment of the cells at a FAM-siRNA concentration of 250 nM or 500 nM for 24 hours, mean fluorescence intensity was analyzed by flow cytometry. The data are shown as the mean ± standard deviation (n = 3).
Abbreviations: TLPD-FPM, targeted LPD when linker PEG was DSPE-PEG-MAL; TLPD-FPC, targeted LPD when linker PEG was DSPE-PEG-COOH; NTLPD-FPM, nontargeted control LPD when linker PEG was DSPE-PEG-MAL; NTLPD-FPC, nontargeted control LPD when linker PEG was DSPE-PEG-COOH; DSPE-PEG-MAL, 1,2-distearoyl-sn-glycero-3-phosphoethanolamine-N-[maleimide(polyethylene glycol)-2000] (ammonium salt); DSPE-PEG-COOH, distearoyl-N-(3-carboxypropionoyl poly(ethylene glycol) succinyl)phosphatidylethanolamine.
