Fig. 1.
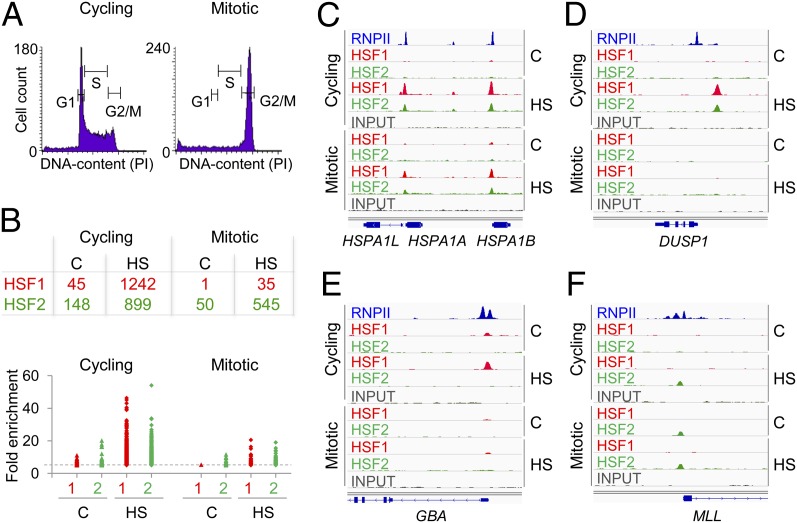
Binding sites for HSF1 and HSF2 in cycling and mitotic K562 cells. (A) Histograms of cycling and mitotic cells based on the DNA content. (B) (Upper) Number of HSF1 (red) and HSF2 (green) target loci in cycling and mitotic cells. (Lower) Fold enrichment over input of each identified HSF1 (red) and HSF2 (green) target locus. The dashed gray line indicates fold enrichment five, which was set as cutoff criterion for HSF target sites. (C–F) Enrichments of HSF1 (red) and HSF2 (green) on indicated target genes in cycling and mitotic cells. (C) HSPA1A and HSPA1B promoters are bound by HSF1 and HSF2 in cycling and mitotic cells. (D) DUSP1 promoter harbors prominent HSF1 and HSF2 enrichments in stressed cycling cells only. (E) GBA is an HSF1-specific and (F) MLL is an HSF2-specific target promoter. Distribution of RNPII in nontreated cycling cells (blue) is recovered from the ENCODE project (wgEncodeEH000616; Snyder Laboratory, Yale University). The scale for each HSF or input sample is set to 0–100, except at the HSPA1 locus, where, due to high enrichments, the scale is set to 0–250 in cycling and 0–125 in mitotic cells. C, control; HS, heat shock.

