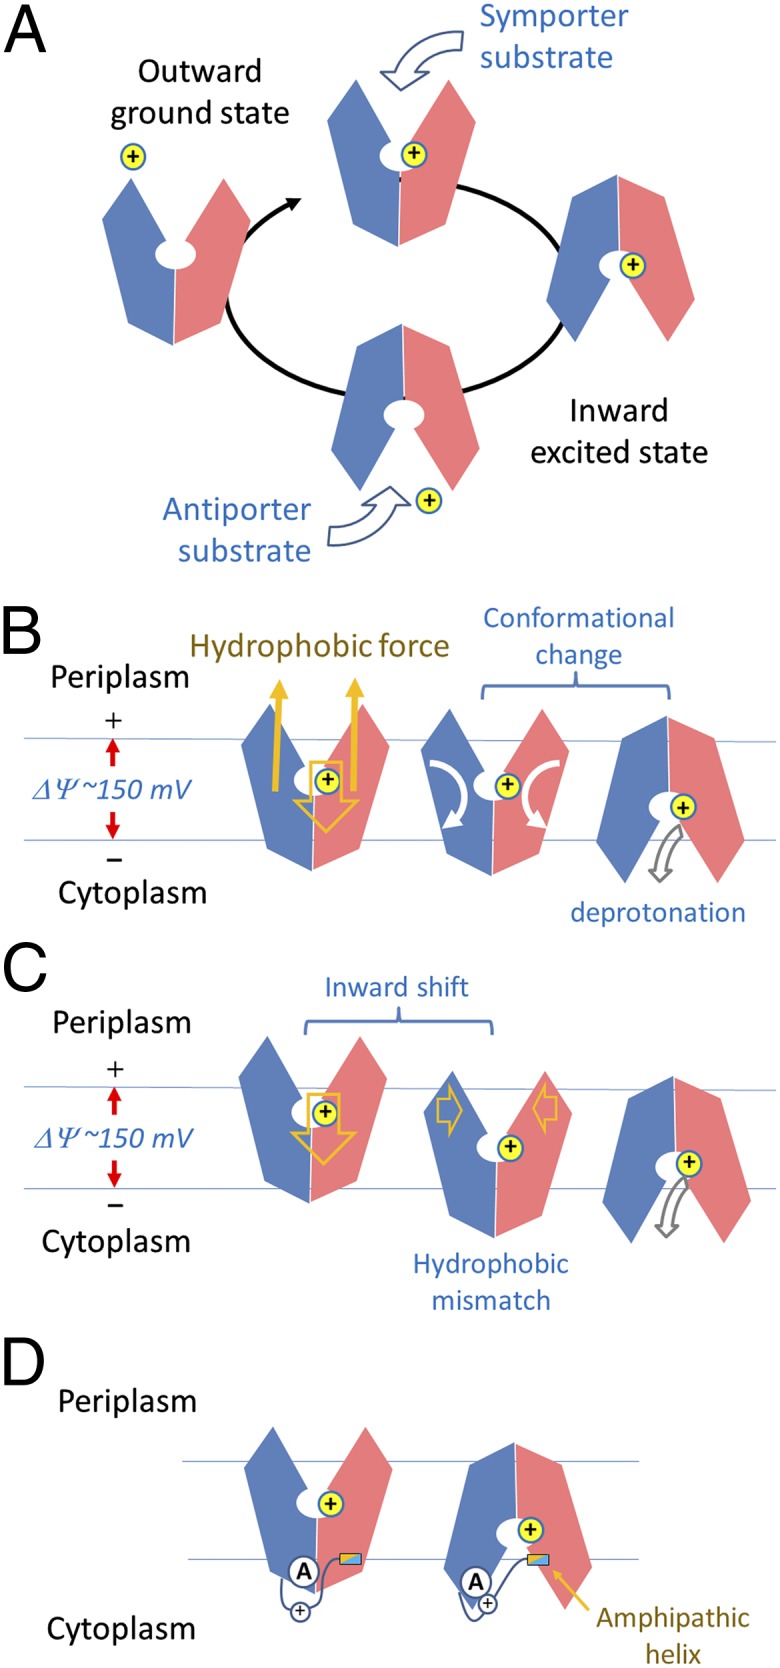
Fig. 3.

Schematic diagram of MFS conformational changes. (A) Changes in a functional cycle of MFS. (B) Changes driven by protonation. Directions of movements are shown in arrows. (C) Alternative mechanism of proton-driven conformational changes. (D) Effects of the interdomain linker on motif A.
