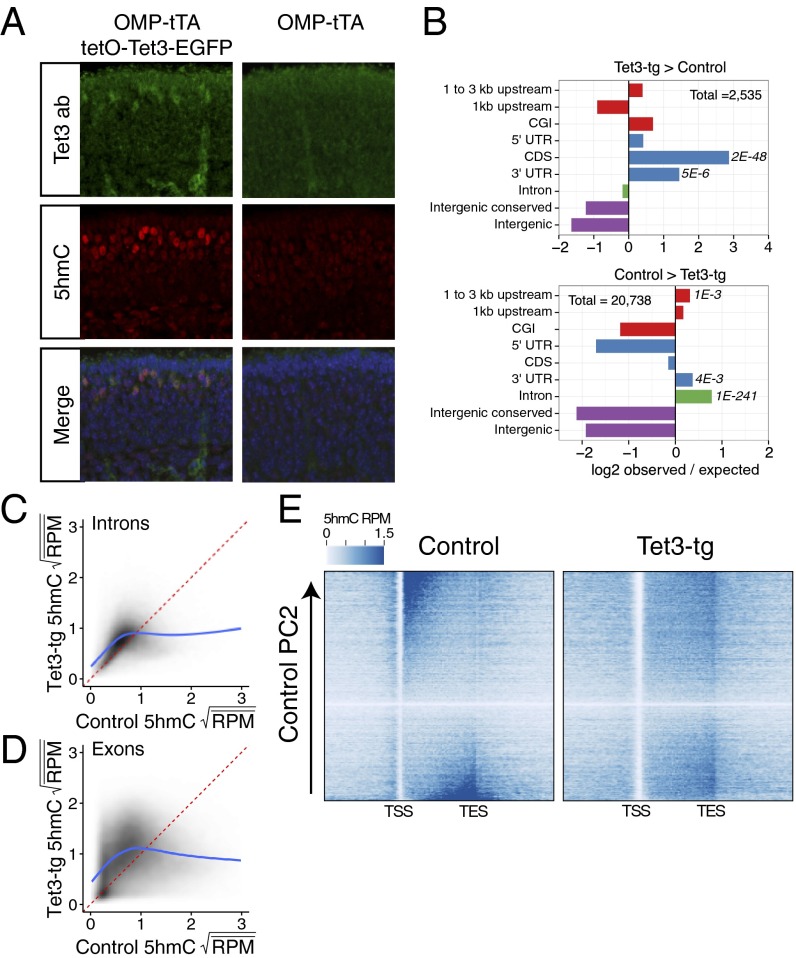
Fig. 4.
Tet3 overexpression alters 5hmC patterning. (A) Immunofluoresence of Tet3 and 5hmC on coronal MOE sections of P0 mice either expressing tetO-Tet3-EGFP in mOSNs (Left) or not (Right). (B) Differential 5hmC peak analysis and genomic feature intersections. Values are log2 ratios of observed versus expected number of peaks within a given region. (Upper) Regions enriched in Tet3-tg versus control mOSNs. (Lower) Regions enriched in control versus Tet3-tg mOSNs. Significance values are one-sided Fisher-test false discovery rates. CGI, CpG island. (C and D) Comparison of square-root mean 5hmC reads per million (RPM) in control and Tet3 overexpressing mOSNs within introns (C) and exons (D). Fitted lines are predicted values from a generalized additive model: R command: gam(y ∼ s(x, bs = ′cs′)). (E) Heatmaps of genic 5hmC in control (Left) and Tet3-tg (Right) mOSNs. Genes are ordered by control 5hmC gene-body levels according to principal component 2 (Materials and Methods).

