Fig. 5.
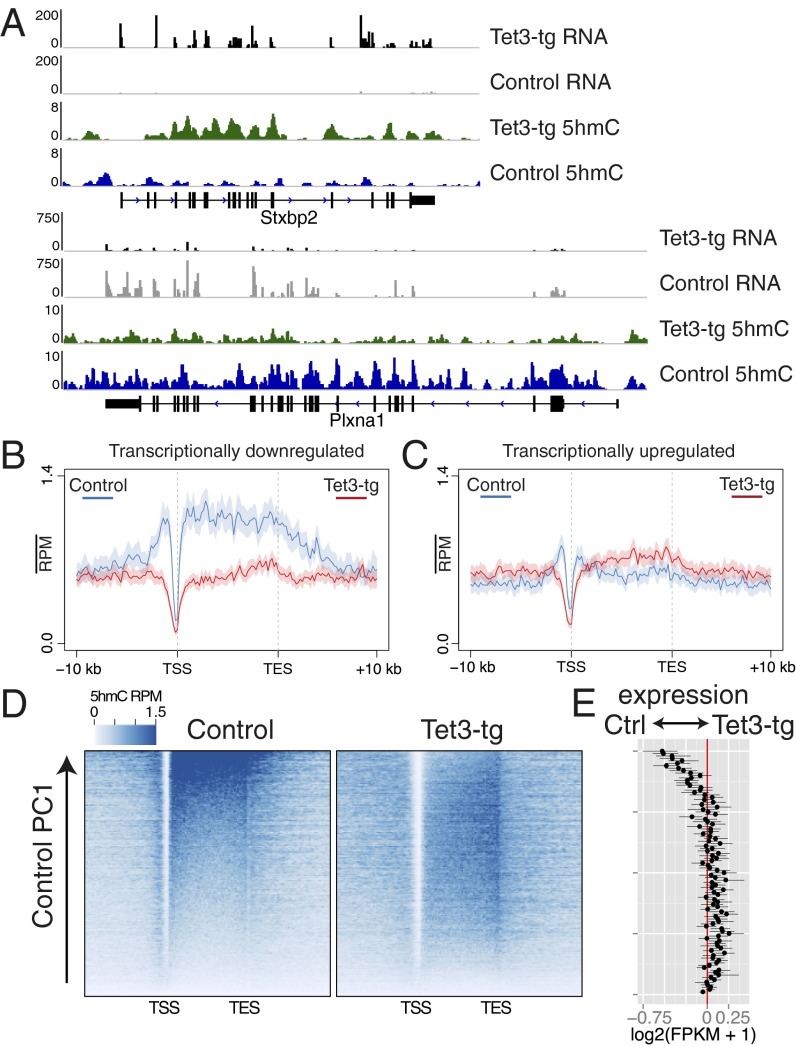
5hmC alterations modulate gene expression. (A) rRNA-depleted RNA (intersected with exons) and 5hmC levels in Tet3-tg and control mOSNs for two representative genes. The y axis is RPM. (B and C) 5hmC profiles over genes transcriptionally down-regulated (B) or up-regulated (C) in Tet3-tg relative to control mOSNs. (D) Heatmaps of gene-body 5hmC in control and Tet3-tg mOSNs ordered by control 5hmC gene-body levels according to principal component 1 (Materials and Methods). (E) Difference between Tet3-tg and control log2(FPKM + 1) values of genes along the ordering used in D. Values shown are the average of these genes grouped into 100 bins. Error bars are 95% bootstrap confidence intervals.

