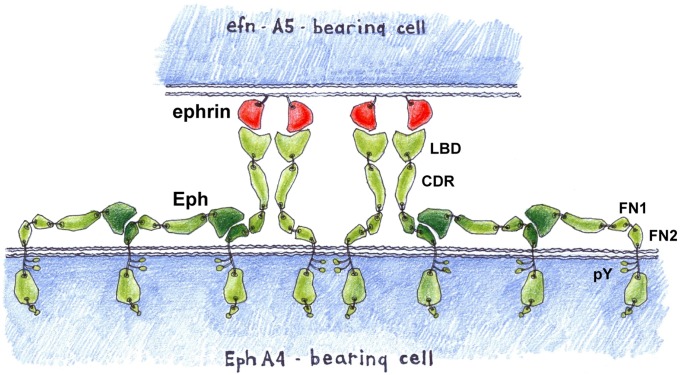
Fig. 5.
The homotypic, head-to-tail Eph–Eph (LBD–FN2) interactions observed in the crystals of unbound EphA4-ECD presumably represent Eph preclustering interactions and could also explain the observation that Ephs form clusters well beyond the area of immediate ephrin contact (22). Provided is a schematic representation of two interacting cells where the Eph clusters on the Eph-expressing cells are larger than the Eph/ephrin contact area, mediated by interactions between the LBDs of ephrin-free Ephs and the FNIII regions of their neighbors. The Eph molecules are colored in green, and the ephrins are in red. Phosphorylated intracellular tyrosines are shown as small circles.

