
Fig. 1.

Design and theoretical analysis of the TrEc consortium. (A) Schematic of the TrEc consortium. Key parameters, identified via sensitivity analysis (in B), are labeled (SI Appendix, section 1 and Table S1). T. reesei produces cellulases (CBHI, cellobiohydrolase I; CBHII, cellobiohydrolase II; EGI, endoglucanase I) that hydrolyze cellulose to soluble oligosaccharides. Oligosaccharides are further hydrolyzed to glucose via cell wall-localized β-glucosidase (BGL). Soluble saccharides serve as growth substrates for the microbes (cellobiose and glucose for T. reesei, glucose only for E. coli). E. coli ferments glucose into isobutanol, which inhibits microbial growth due to toxicity. (B) Global sensitivity analysis of the TrEc consortium model. PRCCs between model parameters and output metrics are shown with hierarchical clustering (Ward’s method, Pearson correlation distance). Parameters are labeled in A. Output metrics are as follows:  , fraction of substrate carbon consumed by E. coli (grams per total grams); QI, isobutanol productivity (grams per gram of cellulose per hour); Rcel, mean cellulose hydrolysis rate (grams per liter per hour); REc, mean E. coli growth rate (grams per liter per hour); RTr, mean T. reesei growth rate (grams per liter per hour); XEc, E. coli population fraction at fermentation end point (grams per gram of total microbial biomass); and
  , isobutanol yield (grams per gram of cellulose). The most significant PRCCs (
 and
and 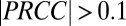 ) are shown here; full results are provided in SI Appendix, Fig. S2. (C) Normalized kernel density estimate (200 × 200 grid, standard bivariate normal distribution kernel) for Rcel vs.
  over all sets of parameter and IC values sampled in sensitivity analysis. Individual points are shown in low-density (<1.25) regions. Axes are padded by 4% at each end to ensure visibility of all data. (D) Theoretical analysis of isobutanol production. Parameter values and ICs correspond to the point denoted by the white asterisk in C, with Fa, fraction of substrate bonds accessible to enzymes, modified to 0.011. Numerical solutions were calculated over a range of initial E. coli fraction,
  , values. Key fermentation metrics are shown (Rcel,
  , and QI); the green dashed line denotes the theoretical maximum of
  (0.41 g/g). More details are provided in SI Appendix, section 2.