
Fig. 2.

Experimental and model analysis of T. reesei (Tr) RUTC30 monoculture and bicultures of T. reesei RUTC30 with E. coli (Ec) K12 or E. coli NV3 pSA55/69. Error bars are ±SD for n = 3 technical replicates. (A) T. reesei RUTC30 monoculture on 20 g/L MCC. Modeling results are shown as smooth lines, and experimental results are shown as points. (B) RUTC30/K12 biculture 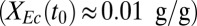 on 10 g/L MCC. (C) RUTC30/NV3 biculture
 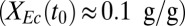 on 20 g/L MCC. E. coli data points are color-coded to indicate population fraction retaining plasmids pSA55/69 (error bars are shown in SI Appendix, Fig. S4C). (D) Fermentation product titers for NV3 monoculture (20 g/L glucose) vs. biculture experiment in C. Error bars are ±SD for n = 2 biological replicates. Acet, acetate; EtOH, ethanol; iButOH, isobutanol; Succ, succinate. (E) Local sensitivity analysis of the RUTC30/NV3 parameter set. The model was integrated with one-at-a-time ±25% perturbations to each parameter/IC (SI Appendix, section 2). Parameter effects were quantified by response coefficients, defined as
  , where
  is the percentage change in output Z and
  is the percentage change in parameter X. Response coefficients for
  and Rcel are shown for top 10 parameters (ranked by
  ), with the color code indicating the direction of the parameter/IC perturbation for the plotted response.