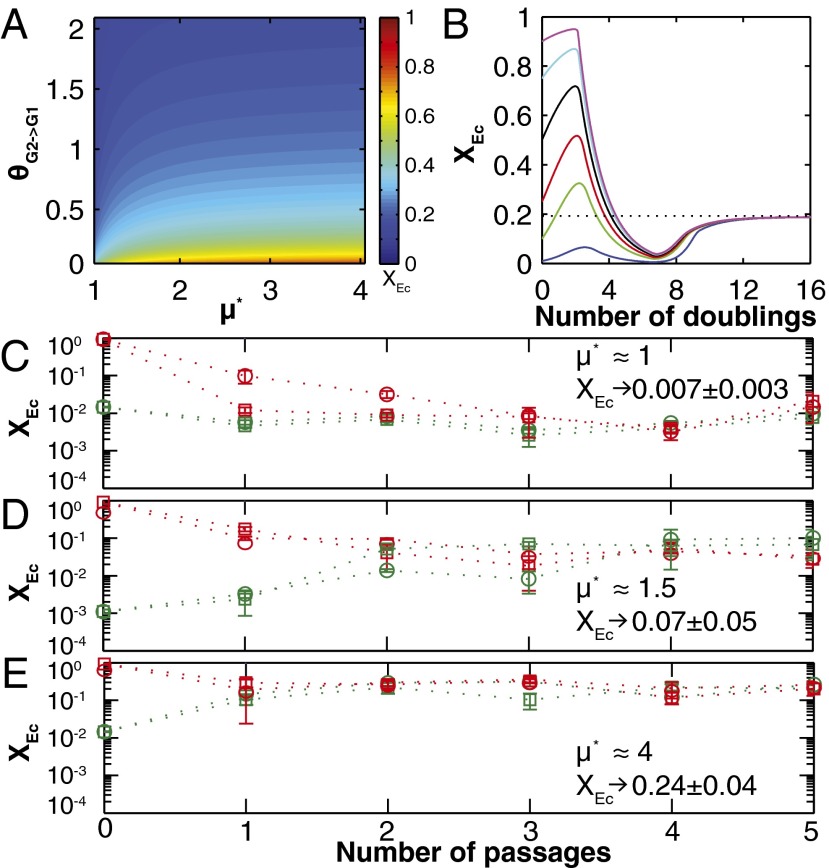
Fig. 4.
Cooperator–cheater dynamics in TrEc consortia. (A) Stability analysis of the TrEc model. Equilibrium population compositions  were calculated over a range of plausible values for
  and
and  . (B) Sample numerical solutions for
  and
and  over a range of
  . (C) Experimentally observed dynamics for RUTC30/K12 bicultures at pH 5.3
  . Cultures were inoculated with high or low
  (red or green points/lines, respectively) in duplicate (circles/squares). Data are shown for each culture, and error bars are ±SD for n = 2 technical replicates. (D) RUTC30/NV3 bicultures at pH 6.0
  . (E) RUTC30/K12 bicultures at pH 6.0
  .
.

