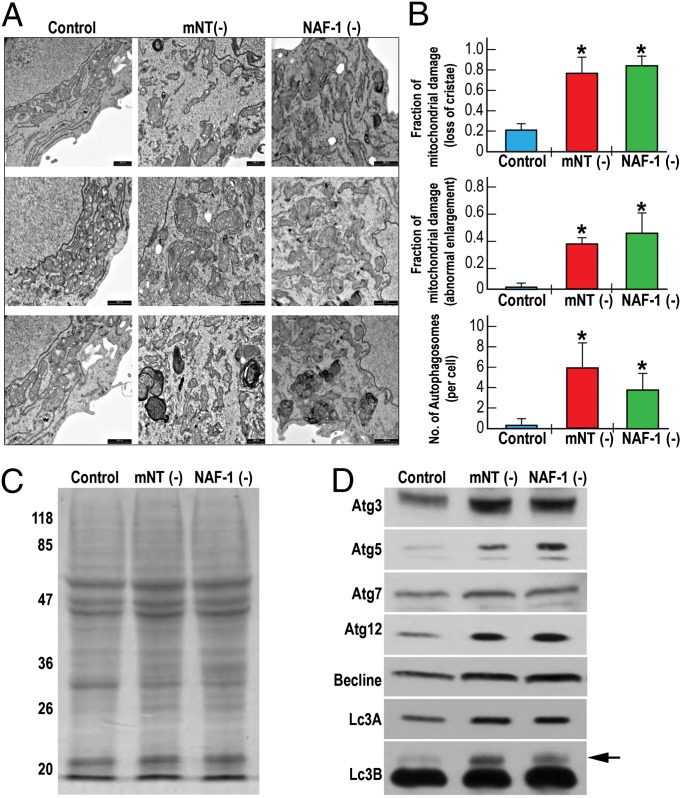
Fig. 3.
Activation of autophagy in human epithelial breast cancer cells with suppressed expression of mNT or NAF-1. (A) Three representative transmission electron microscopy (TEM) images of mitochondria from control cancer cells (Left) and cancer cells with suppressed expression of mNT (mNT−; Center) or NAF-1 (NAF-1−; Right). (B) Quantitative analysis of mitochondrial damage in the form of loss of crista (Top), abnormal elongation (Middle), and the accumulation of autophagosomes (Bottom) in TEM images from control and mNT− or NAF-1− cells. (C and D) Protein gel analysis (C) and protein blot analysis (D) showing accumulation of autophagy marker proteins in breast cancer cells with suppressed expression of mNT (mNT−) or NAF-1 (NAF-1−). Autophagy is shown to be activated in human epithelial breast cancer cells with suppressed expression of mNT or NAF-1. The arrow indicates the position of Lc3B. *P < 0.05.

