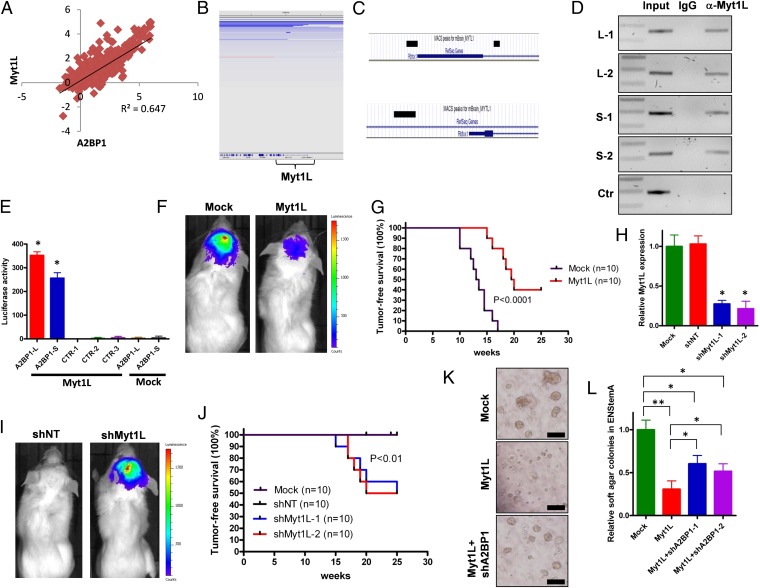
Fig. 3.
Myt1L is a transcription factor that directly regulates A2BP1 expression under neural/glioma stem cell context. (A) Plotted correlation between A2BP1 expression levels and Myt1L expression levels in human GBM samples. (B) IGV representation of deletion of Myt1L locus in GBM. (C) Enrichment of Myt1L binding sequences (black bars) in two A2BP1 promoters identified with CHIP-Seq. (D) Verification of Myt1L binding sequences of A2BP1 promoters by CHIP-PCR with multiple sequences. L and S, A2BP1 promoters driving expressions of long and short transcripts, respectively. (E) Luciferase assay of A2BP1 promoters with overexpression of Myt1L or mock. L and S, A2BP1 promoters driving expression of long and short transcripts, respectively *P < 0.0001 compared with controls. (F) Representative images of intracranial tumor formation of p53−/−Pten−/− GSCs with Myt1L overexpression or mock. (G) Kaplan–Meier survival curves (log-rank test) of mice with intracranial injection of p53−/−Pten−/− GSCs with Myt1L overexpression or mock. (H) Knockdown of Myt1L in p53−/−Pten+/− PM-NSCs with shMyt1L or control shRNAs. *P < 0.0001 compared with mock or shNT controls. (I) Representative images of intracranial tumor formation of p53−/−Pten+/− PM-NSCs with shMyt1L or control shRNA. (J) Kaplan–Meier survival curves (log-rank test) of mice with intracranial injection of p53−/−Pten+/− PM-NSCs with shMyt1L or control shRNA. (K) Representative images of anchorage independent soft agar growth of p53−/−Pten+/− PM-NSCs with Myt1L overexpression with/without A2BP1 knockdown in EN-stemA medium. (L) Statistical analysis of K. (Scale bars, 50 μm.) *P < 0.001, **P < 0.0001. Error bars indicate SD.

