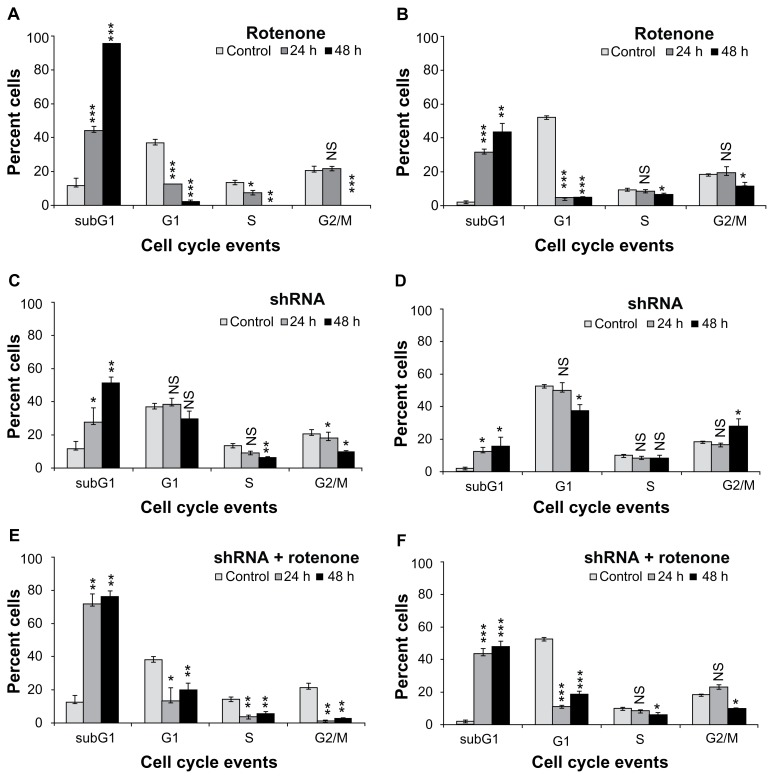
Figure 1.
Rotenone induces cytotoxicity independently of cell cycle inhibition. BC-8 cells were treated with (A) rotenone, (C) shRNA, and (E) combination for 24 and 48 h and were analyzed by FACS. IMR-32 cells treated with (B) rotenone, (D) shRNA, and (F) combination for 24 and 48 h were analyzed by FACS. Based on DNA content analysis, cell cycle phases were separated and are represented in the bar diagram. White bars are untreated cells, grey bars are 24 h treatment, and black bars are 48 h treatment. The Y-axis represents percent cells in each cell cycle phase mentioned in the X-axis. The values represented are mean ± SD. To calculate statistical significance, control values were compared with 24 and 48 h treatments. *P < 0.05; **P < 0.01; ***P < 0.001; NS, not significant.

