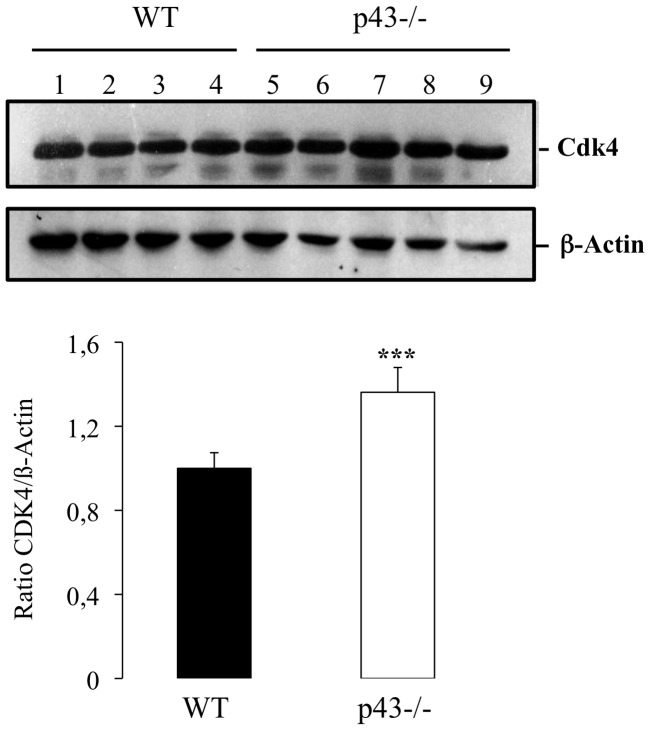
Figure 5. CDK4 expression is increased in P43−/− testis at P3.
Western blot analyses were performed with p43−/− and WT proteins extract testes at P3 (n = 5 for P43−/−, n = 4 for WT) using a specific CDK4 and ß-actin antibodies. Normalization was achieved using ß-actin levels. Data are shown as the mean+/− SEM and statistical analyses were performed using the student t test. CDK4 level was increased (P<0,001).

