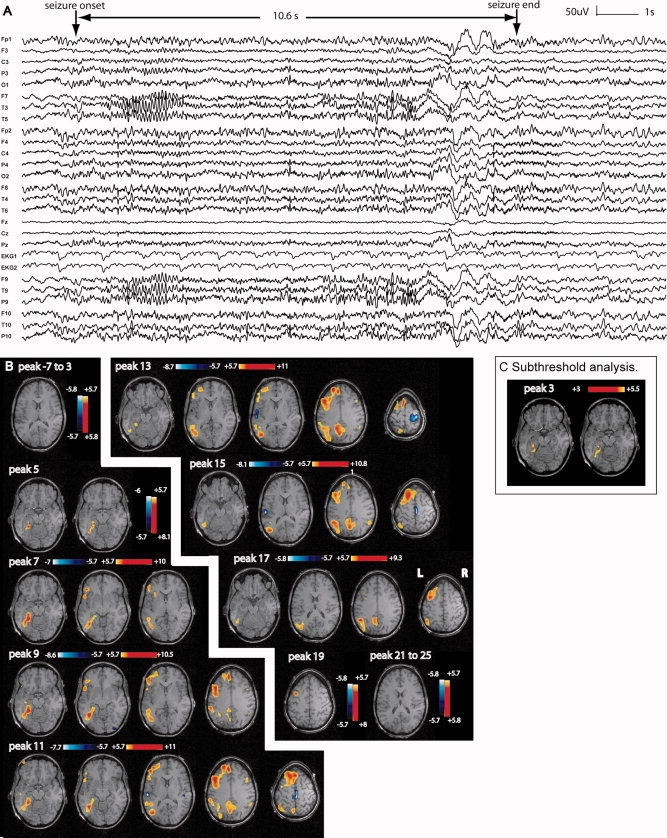
Figure 7.

Patient 2: A: Electrical seizure lasting 10.6 s recorded during EEG–fMRI test. In a referential montage (reference FCz), the seizure started with left temporal sharp waves followed by a clear 11–12 Hz discharge also over the left temporal area. A decrease in frequency with left fronto‐temporal slow waves was seen at the end of the seizure. B: The first significant activation started at peak 5 very focally in the left posterior hippocampus and parahippocampal gyrus. The propagation of the activation was first and mainly homolateral, with later minimal bilateral involvement of the anterior and posterior cingulate areas at peak 11. A deactivation was seen late and distant from the focus. C: After lowering the statistical threshold to three, successive F‐maps preceding the first significant activation map (peak 5) showed new activation located in a similar area as the first significant activation.
